


Over the years, I have learned many things about evaluating players, but especially pitchers. As a fledgling analyst in college (in the early-to-mid-2010s), I thought I was ahead of the curve by using SIERA when my peers did not. Then, I learned to lean on Statcast data more recently, using xwOBA and the like to get ahead. Come to find out, I was misusing all of these tools all along, and that led to me putting misguided faith in players that I should not have been confident in, as well as distrust in players that I should have liked. I was full of deluded confidence.
As an analyst, I consider myself from the school of Jeff Sullivan, and more recently Nick Pollack. I’ve learned a great deal from Eno Sarris and Alex Chamberlain as well. You’ll notice that we all have different niches — this is why, say, Jeff and Nick talk about pitching from different perspectives, and often come to slightly different conclusions. In learning from them, I’ve learned to use advanced statistics more appropriately, which has led to me feeling more strongly about players — whether that means liking or disliking them. Sometimes I’m right, sometimes I’m wrong, but I always lean into whatever I’m feeling. I feel like my analysis chops have improved exponentially in the past year and a half at Pitcher List, and that’s due to because I’ve done everything I can to gauge what situations it’s appropriate to use certain metrics, when it is not, and how to be efficient in my analysis.
Here, I’m going to do my best to get across what I’ve learned about evaluating pitchers, but given the fluid nature of pitching analysis, it would be impossible to get into everything I do, because after my preliminary analysis it is a completely different process for every single pitcher I evaluate. With that in mind, we’ll begin.
Starting Point
Obviously, we want to get a quick look at a player to see if it’s worth looking into any further. That should require a quick glance at FanGraphs and Baseball Savant. For the former, you will find me glancing at their K-BB% (and K% and BB% alone), HR/9, and their ERA, FIP, xFIP, and SIERA. That should tell me a lot about that player right away. For Andrew Heaney, a look at his FanGraphs player page tells me that he strikes out hitters at an elite rate and doesn’t walk too many hitters, but he also has historically served up a lot of dingers. That explains why his ERA and FIP aren’t great, but his xFIP and SIERA are solid. (We’ll touch on ERA estimators and their strengths and limitations later.)
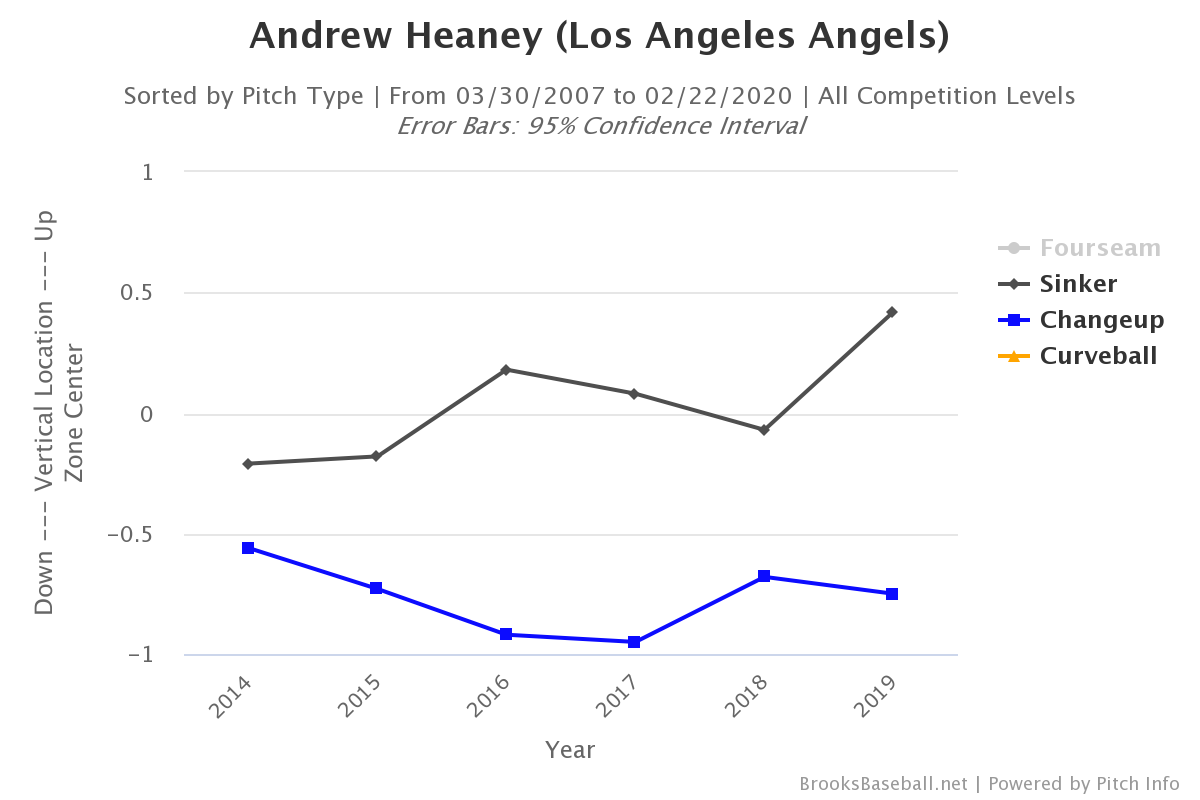
Then, I want to get a grasp of their pitch mix and velocity. I like to do this visually, so that generally means looking at Baseball Savant or Brooks Baseball. For pitch mix, we want to see a deep repertoire that does not lean too heavily on a fastball. In terms of velocity, I think of 94 mph as the threshold to break, but it depends on spin rate. Again, with Heaney as our example, we see a sinker that he throws 58% of the time, and a curveball and changeup that he throws 27% and 15%, respectively. For him, he checks the boxes: good enough velocity, plus-plus spin rate, and a three-pitch repertoire. I like the overall package here, but I should note that Heaney can’t afford to lose velocity or feel for his pitches than, say, Blake Snell can. We’ve seen this play out, as he struggled with the feel of his changeup for much of 2019 (he was returning from injury), and his sinker and curveball got lit up.
Digging Deeper
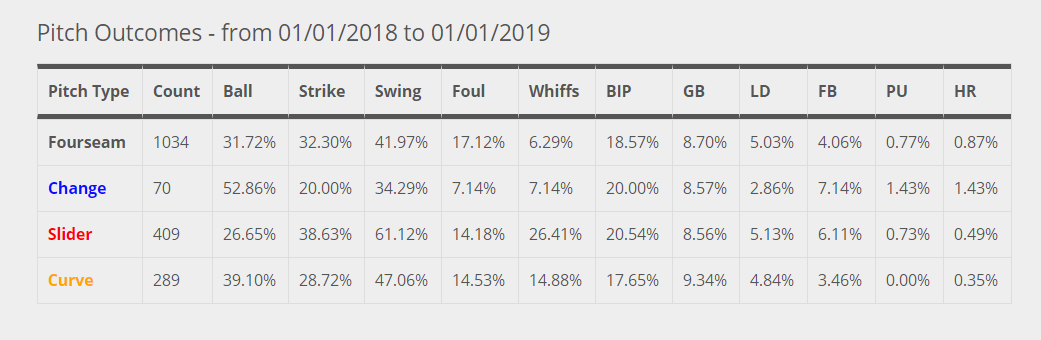
My next step (especially with pitchers that I’m not very familiar with) is to check their pitch-type splits — Heaney’s page is really encouraging. What it tells me is that he has three offerings with potential. Generally, what I look at is whether or not the pitcher has multiple pitches with good swinging-strike percentages. Swinging-strike percentage is relative, in that a 10.0% swinging-strike percentage is good for a fastball, but not for a curveball. At Pitcher List, we classify a Money Pitch as a pitch that meets the criteria of a 40% O-Swing rate, 40% zone rate, and 15% swinging-strike percentage. For breaking and offspeed pitches, that’s what I’m looking for. Again, all of these numbers matter, but I think O-Swing rate, zone rate, and swinging-strike percentage matter most, and they give us the quickest idea of what kind of offering any given pitch is. The rationale is that one measures how often hitters chase, one looks at how much it’s thrown in the zone (i.e., does it get strikes?), and how much of a whiff pitch it is.
In this case, Heaney has a really strong sinker (which is incredibly rare). That’s because it’s a peculiar sinker, in that it rises instead of sinks, but its 11.5% swinging-strike percentage is easily the highest in the league for sinkers. It also grades out well in comparison to four-seamers too. He throws it in the zone a ton (62.6% zone rate) and gets whiffs nonetheless.
Heaney’s curveball is great, too. With a 42.3% O-Swing rate and 19.3% swinging-strike percentage, it checks the two most important Money Pitch criteria. With his plate discipline numbers, you can learn a lot about the pitch itself. Given its 28.4% zone rate, you may think he should throw it in the zone more. He shouldn’t! Given that (a) hitters chase, and (b) its zone-contact rate is 95.1%, it’s best served as a plate that he throws out of the zone. That means it’s pretty necessary that he has another pitch that he can throw in the zone.
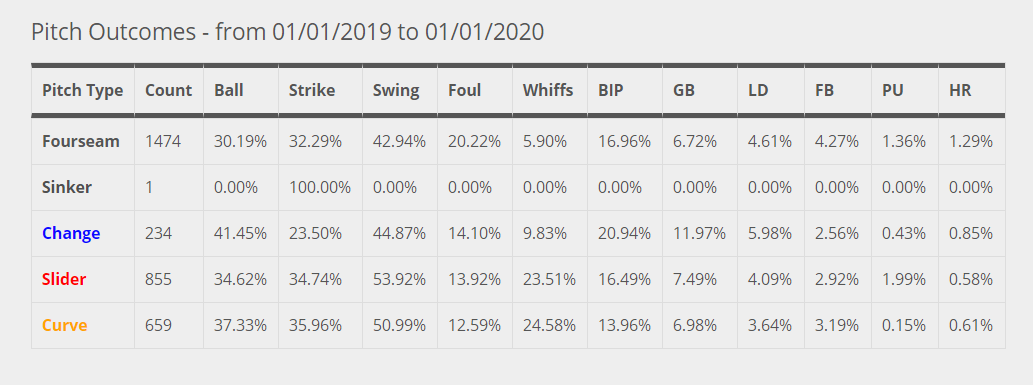
When I wrote about Heaney, I did so for several reasons, but a large reason was that his changeup was nowhere to be found. He had struggled to find the feel for his changeup for most of the year. This is evidenced by his O-Swing rate dropping from 44.0% in 2018 to 34.1% in 2019. In my opinion, this is the pitch that will make or break Heaney. Without it, he’s left with a curveball that he rarely throws in the zone, and a fastball that gets whiffs but gets hit hard. His changeup was a Money Pitch in 2018 — and it was still a strong pitch at times during this past year — but he struggled with it in 2019, as evidenced by its depressed O-Swing rate.
The takeaway here is that Heaney has one positive pitch pVAL in his sinker, and two negative pitch pVALs in his curveball and changeup. pVAL isn’t predictive, but it often does a good job of signaling when pitches masquerade as good pitches (i.e., by O-Swing rate, zone rate, and swinging-strike percentage) but still get beat up. Since pVAL is based on changes in run expectancy, it does a good job of signaling what pitches are strike-getters, and what pitches get hit hard. Again, it’s not predictive, but it is very, very descriptive. Overall, it’s encouraging that he has a swing-and-miss sinker and two other offerings that draw whiffs too.
Then there’s Baseball Savant, which also has a wealth of information. But we need to assure not to misuse it. This is something I find exceedingly common. Too common!
Strike Getters
You didn’t think I wasn’t going to write about CSW (Called Strikes plus Whiffs), did you? If you’re not familiar with CSW, you can read about it here, but essentially what it does is tell us: is the pitcher earning strikes? Foul balls aren’t as much of a repeatable skill as called strikes and whiffs, and so it’s looking at how well pitchers earn strikes in the most effective, sustainable way. It’s simple, which sounds like a criticism, but I think that’s what makes CSW so incredible.
This information has sort of been available all along. Over at Brooks Baseball, you can find strike percentage in the tabular data section of player pages. Let’s look at my sweet boy, Shane Bieber.
2018:
And 2019:
When I look here, all I’m looking for aside from BIP (balls in play percentage) is strike percentage. There are a bunch of other numbers, and they’re all interesting enough, but all I want to see is if the pitcher has what I call strike getters. Given that we know the average CSW is about 28.6%, then we want to see at least a few pitches cross the 30% threshold. A note: of all pitches, changeups, and splitters are historically the worst strike getter of any pitch. Why? Because pitchers throw them in the zone so infrequently, and they don’t always get chases as sliders or curveballs do. But also, they get put into play more! Even Luis Castillo, whose changeup is something fierce, has just a 33.7% strike percentage on his changeup.
If you think about it, you need a few of these pitches. If you can’t work deep into counts (and favorably), then you’re going to need to really lean on luck and sequencing, or contact management. That’s not ideal! So, for the most part, you can trust this approach. (Yes, there are probably a number of exceptions.) You just need to be mindful that changeups and splitters are going to mislead you if you’re not careful. They have low strike percentages, yes, but they’re also probably inducing a lot of groundouts with their changeups and splitters, too.
Kyle Hendricks is a fantastic example:
Hendricks has two strike getters, a great changeup that induces weak contact, and a curveball that — while rarely used — is a strike getter when he needs it.
This is also why we like, but don’t love, Mike Soroka:
His fastballs — which make up the vast majority of his pitches — are both not strike getters. Again, this is because his sinker is put in play so often (which often means a ground ball, which is good), but he’s always going to lack in the strikeout department because of that. It’s a mixed bag. In any case, Soroka has a changeup that grades out really well by strike percentage, and his slider is pretty good too.
This is one of my favorite, and most underrated, resources. CSW rocks.
Using Statcast Wisely
Of any Statcast metric, I think xwOBA gets abused the most on the pitching side of player evaluation. Something I’ve learned (via Alex Chamberlain) is that, for pitchers, xwOBA can be misleading. That’s because, both overall and at the pitch-type level, wOBAcon and xwOBAcon are subject to a lot of statistical noise. Not only can pitchers get lucky by their wOBAcon outperforming their x/wOBAcon, but they can also just be fortunate with depressed xwOBAcon values (or misfortunate with elevated xwOBAcon values). Chamberlain used Zack Wheeler as an example, in that his breakout 2018 was essentially just a result of statistical noise. To varying degrees, you could say the same thing about Aaron Nola or Trevor Bauer in terms of pitchers who looked like they could be aces. And then there are players whose improvements were overstated, such as Miles Mikolas, Mike Foltynewicz, and Kyle Freeland. This makes xwOBA difficult to trust. (I mean, Tyler Glasnow had a .230 xwOBA as a starter in 2019. That’s better than Gerrit Cole. We know that’s not all real.)
The easy takeaway is to not trust breakouts that are based on contact management skills if they’re not supported by changes in swinging-strike percentage (and by extension, CSW). Ever! We know that contact management skills are not sticky year-to-year (except for some players), and we know that swinging strikes are. And so, if you’re looking to understand the legitimacy of a breakout, the player should have a strong K-BB%, supported by a good swinging-strike rate, and a wOBAcon that is not unsustainably low. There are exceptions to this rule (e.g., Zack Greinke, Kyle Hendricks, and Hyun-Jin Ryu), but, uh, they’re exceptions to the rule. Plus-plus command appears to be one way to circumvent the unsustainability of contact management, and a deep repertoire is a good way to overperform peripherals too.
All in all, a wOBAcon and/or xwOBAcon that are abnormally elevated or depressed is a great way to get ahead on understanding a player’s true talent level. I just wrote up Soroka, in which my conclusion was that I believe in his contact management skills, albeit not to the extent in which he limited hard contact in 2019. Looking at wOBAcon and xwOBAcon at the pitch-type level should be a core part of your analysis. You can do that here. It is for me.
Pitch-Type Deliciousness
Thanks in part to Chamberlain — especially because of his pitch leaderboard — much of my analysis is moving to the pitch-type level. This is where we can identify a lot of issues (or strengths) that cannot be identified at a grosser level. There are several numbers to consider, but what we mainly want to identify is if a player’s pitches have a wOBAcon, xwOBAcon, or BABIP that is significantly elevated or depressed.
Time after time, we think, “This guy is going to be the pitcher to break xwOBAcon or BABIP.” [Narrator: He was not the pitcher to break xwOBAcon or BABIP.]
When I do Going Deep articles, this is where my analysis starts after looking at changes in swinging-strike percentage and CSW. This is absolutely, positively one of the biggest market efficiencies in baseball as it pertains to pitching analysis. For this reason, you will find that most (if not all) of my articles now use this as a core part of my analysis. And if I don’t explicitly write about it, you can bet that I’ve still looked into it.
I’m going to show you how I do it, but if you’d like a stronger explanation, read Chamberlain’s here. If you want to see me in action utilizing this method, read my Sonny Gray article, or my recent Mike Soroka piece.
Ready? Away we go.
I admit that it’s a somewhat convoluted process, but first and foremost, you need to use Chamberlain’s Tableau, which at this point has likely saved me hundreds of hours in poring over pitch-type information with something more time consuming, like Baseball Savant’s search tool. Once you’re there, you’re going to want to have your chosen pitcher’s wOBAcon, xwOBAcon, and BABIP (at the pitch type level) at your disposal. Then, you’ll want to click on the benchmarks tab to bring up league average data. Again, we’ll do Heaney. I love Andrew Heaney.
Immediately, I recognize him as a candidate for positive regression. Across the board, his wOBAcon is elevated on all of his pitches.
| wOBAcon | xwOBAcon | |
|---|---|---|
| Sinker | .418 | .399 |
| Curveball | .477 | .429 |
| Changeup | .423 | .394 |
Already, we can see that, assuming his pitch type xwOBAcons are reasonably sustainable, Heaney should see the wOBAcon of all of his pitches drop next year. You may think that this logic is drifting towards gambler’s fallacy, but it’s not. These numbers are really, really high. Unsustainably high!
Since 2015, here is a list of pitchers with breaking or offspeed pitches (>2,000 pitches) with a wOBA greater than .423:
- Robbie Ray, slider
- Carlos Carrasco, slider
That’s it. That’s the list.
This is one way to know if it’s sustainable that his secondaries are getting lit up this badly. How else can we do so? Well, for one, let’s compare Heaney to…Heaney.
| wOBAcon (2015-18) | wOBAcon (2019) | xwOBAcon (2015-18) | xwOBAcon (2019) | |
|---|---|---|---|---|
| Sinker | .417 | .418 | .410 | .399 |
| Curveball | .392 | .477 | .400 | .429 |
| Changeup | .307 | .423 | .345 | .394 |
Granted, you can’t do this for some pitchers. If they’re a rookie or lack a meaningful sample size, it’s difficult to put too much weight into it. Here, we’re running into this problem, because (a) Heaney has spent a great deal of his time in the major leagues less than 100%, and (b) from 2015 to 2018, Heaney has a sample of 342.2 innings to draw from. That’s not a huge sample, and he hasn’t really ever been completely healthy, but it’s good enough to read into.
In 2019, Heaney pitched just 95.1 innings. Thus, we should trust his career data far more than his 2019. In any case, we see a bump in the wrong direction for Heaney’s curveball’s xwOBAcon, and his changeup is even more drastic. By wOBAcon, it’s even considerably more drastic (which tells me that it’s also less sustainable). His curveball’s wOBAcon has spiked by nearly 100 points, whereas his changeup has by more than 100.
Now, wOBAcon and xwOBAcon aren’t thrown very much in public discourse, so you’re forgiven if you don’t have a strong frame of reference for what makes up a good or bad wOBAcon or xwOBAcon. The easiest way to do that? Compare it to the league.
| wOBAcon (Lg Avg) | wOBAcon (2019) | xwOBAcon (Lg Avg) | xwOBAcon (2019) | |
|---|---|---|---|---|
| Sinker | .409 | .418 | .402 | .399 |
| Curveball | .371 | .477 | .356 | .429 |
| Changeup | .337 | .423 | .336 | .394 |
Right away, I should note that, for league average, I pulled four-seam fastball numbers — not sinkers. This is because Heaney’s sinker is more four-seam than sinker (but it’s not really either).
With that out of the way, you’ll find that Heaney’s secondaries were considerably worse than league average by wOBAcon, and also a lot worse by xwOBAcon. Given his career numbers, it may be injudicious to expect his numbers to fall all the way to league average, but we should expect some regression. What Heaney did (i.e., underperform) as significantly as he did in 2019 is difficult to do.
Thus, given Heaney’s .424 wOBAcon and .396 xwOBAcon (via Chamberlain’s Tableau) we can expect positive regression from that alone. But his .396 xwOBAcon might be inflated, too, so there are two routes in which Heaney could (and perhaps should) improve next year.
And so, this is why we do not trust Heaney’s .325 wOBA and .320 xwOBA in 2019. They do a good job of what they’re supposed to do, which is being descriptive, but they’re not predictive, and thus not numbers we trust.
The TL;DR for this section is to compare a pitcher’s pitch type wOBAcon from any given year to their career averages and the league averages for any given pitch type. For the most part, the only ways around this level of analysis are not accounting for injury, defense, park, and plain ol’ luck and sequencing.
Potential Tweaks
There are often changes we want pitchers to make, and they often don’t make them. Sometimes they do! This is all about projectability.
In 2019, Heaney finally elevated his sinker (that feels weird to say):
There are a few ways to know if elevating one’s fastball is a good idea. Generally, fastball velocity, spin rate, and active spin rate are all positively correlated with whiffs up in the zone.
First, we can look at it visually. Here’s Heaney’s career whiffs on his sinker:
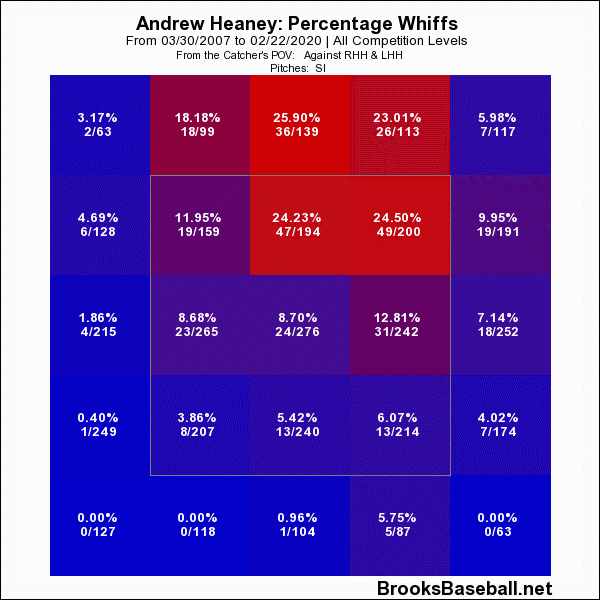
That’s on a sinker! Heaney has about average fastball velocity, but he is incredible at getting whiffs when he elevates his sinker to his arm-side. You can also see that it grades out amazingly by spin rate, and by active spin rate. It has all the makings of a plus pitch.
Some pitchers don’t need to change their approach so much as simply alter their pitch mix. Dylan Bundy is an obvious candidate — I wrote up some changes I think he’ll make in 2020. His sinker isn’t great, but it’s significantly better than his fastball, which is awful. Thus, within the article, I assigned each of his pitches xwOBA values to projestimate what his 2020 xwOBA could be with a realistic change in pitch mix. Here’s what I found:
| Four-seam | Sinker | Slider | Curveball | Changeup | |
|---|---|---|---|---|---|
| Pitch % | 25.0 | 20.0 | 30.0 | 10.0 | 15.0 |
| xwOBA | 0.379 | 0.386 | 0.191 | 0.283 | 0.328 |
| Pitch% * xwOBA | 0.09475 | 0.0772 | 0.0573 | 0.0283 | 0.0492 |
| Final xwOBA | 0.307 |
Bundy has a fantastic changeup, and an elite slider as well. The more he uses those and the less he uses his four-seamer, the closer he gets to being a good starting pitcher.
The Eye Test and Visuals
Sometimes we forget to use the eye test, and I think — along with his experience of actually having been a pitcher — this is what sets Nick Pollack apart as a pitching analyst. Obviously, right? This, of course, can mean so many things. I love watching video, but often we don’t do that. And that’s okay. So let’s think about this in the context of visuals.
Let’s look at the approach of Caleb Smith between 2018 and 2019.
Here’s his approach against righties in 2018:

And against righties in 2019:

The transformation is beautiful. He does a much better job of elevating his fastball, his changeups are located much better (arm-side, down and away), and he keeps his slider away from the middle of the plate. (I didn’t mind his approach before — backfooting sliders is a great way to pitch righties — but this works too.) To me, there’s no better way to look at a pitcher’s approach than doing this, because it allows you to see how they’re locating their pitches, and how their pitches interact with one another. I love looking at these plots.
Sometimes, you’ll find that a pitcher tightens up their release point like Luke Weaver:
And they improve their command as a result:

I obviously can’t get to every single graphic I use, but there are so many boxes to check to assure that a pitcher isn’t bamboozling you. When I wrote about Weaver, I wasn’t convinced that he developed his cutter until I noticed the improvements in release point repeatability and command. I noted earlier that looking at things like average fastball location is helpful. But averages can be quite deceiving. Pitch plots can be too depending on your selected grid type (5×5, 10×10, or KDE), but together, they pair better than, I don’t know, some cabernet and a good steak.
Use FanGraphs, Baseball Savant, and Brooks Baseball for these purposes. They are your friends!
ERA Estimators
There are a ton of ERA estimators. All are good, all serve a purpose, and all have their flaws. Here’s some useful information:
correlation with same-year ERA
(n=274; 2017-18; 1,500+ pitches in a season)0.78 FIP
0.64 xFIP
0.64 SIERA
0.55 CSW [(called + swinging strikes) / pitches thrown]…with next-year ERA
(n=292; 2015-18; 1,500+ pitches in both seasons)0.48 SIERA
0.47 xFIP
0.40 CSW
0.38 FIP— Alex "Oxlade" Chamberlain (@DolphHauldhagen) May 30, 2019
Okay, so within-season, you want to use FIP. That makes sense. After all, FIP looks strictly at strikeouts, walks, and home runs, which are hugely important traits. The reason why it is so correlative with ERA in-season is that FIP is essentially explaining what happened within that season. It’s really descriptive. The reason why FIP is bad at correlating with next-season ERA is that home runs are really noisy, and walks and strikeouts fluctuate some too. So it makes sense that xFIP is stronger, because xFIP assigns a league-average HR/FB% in place of the pitcher’s actual HR/FB%. Thus, instead of saying, “This is what happened,” it’s saying, “This is what probably should have happened.” A lot of people dog on xFIP, because it can be problematic for pitchers who consistently over- and underperform their ERA relative to their xFIP. But if you simply account for (a) contact quality, and (b) flyball and groundball rates, then it’s a very useful tool.
You’ll find that xFIP and SIERA are often really similar in practice, and here, you’ll see that the correlations are really similar too. For this reason, I’ve begun to fade SIERA from my analysis.
From Baseball Prospectus, here’s the formula for SIERA:
SIERA = 6.145 – 16.986*(SO/PA) + 11.434*(BB/PA) – 1.858*((GB-FB-PU)/PA) + 7.653*((SO/PA)^2) +/– 6.664*(((GB-FB-PU)/PA)^2) + 10.130*(SO/PA)*((GB-FB-PU)/PA) – 5.195*(BB/PA)*((GB-FB-PU)/PA)
For me, it simply has far too many inputs and correlates too similarly to xFIP to have a strong preference for it. I really love the concept of SIERA in theory, but it doesn’t set itself apart for me to care enough. I still glance at it, but it’s effectively xFIP.
On FanGraphs, you will find ERA, FIP, xFIP, and SIERA available on player pages and leaderboards. To me, I see analysts use ERA estimators erroneously. For example, I often see people us xFIP or SIERA in samples as small as, say, 28.0 innings. As you can see in the beast of a formula above, that’s probably not a good idea. Instead, you can probably just use FIP. Unfortunately, I cannot for the life of me find it to cite, but I have seen that SIERA should not be used before the 40.0 inning threshold.
Lastly, we should use the “minus” stats more! After all, they’re park and league adjusted, and so they do a way better job of contextualizing a player’s current (and past) environment than the others. A 3.80 FIP doesn’t mean the same thing in 2019 that it did in 2009, but an 80 FIP- means the same thing in both years. It’s amazing!
(As a side note, I found the “plus” stats over at FanGraphs to be heavily underutilized as well. Just a thought!)
Sustainability
Aside from viewing pitch type wOBAcon and xwOBAcon, a quick way to look at this is a pitcher’s HOTEL. That is, the Holy Trinity Equating Luck, which includes BABIP, left-on-base percentage, and HR/FB rate. Of course, I think looking at wOBAcon and xwOBAcon tells us more than BABIP, but BABIP is useful too! Its only shortcoming is that it doesn’t take home runs into account (which is a limitation by design, but also slightly silly).
In any case, we should have known Blake Snell’s 2018 wasn’t legitimate, right? With a .241 BABIP, 88.0 LOB%, and 10.7% HR/FB, the warning signs were all there. This isn’t always helpful. The jury is still out on Trevor Bauer, who had a .297 BABIP (normal!), 79.5 LOB% (mostly normal), and 6.2% HR/FB (not normal, and very low!). His pitch type wOBAcon/xwOBAcon, HR/FB, and 0.46 HR/9 tell you all you need to know: he was lucky too.
The CliffsNotes
- K-BB% is king
- Use wOBAcon/xwOBAcon to identify regression candidates
- It’s hard to breakout without the ability to induce whiffs
- Are they optimizing…
- Pitch location
- Pitch mix
- Spin rate is good
- But active spin rate adds important context
- Don’t misuse and abuse Statcast
- Use visuals and the eye test!
- Use FIP within-season and xFIP/SIERA for next-season
- No, Player A is not the exception to the rule…
Conclusion
If there is one thing to take away from this article, it’s that there are many ways in which you can be led astray by statistics—both advanced and conventional. I still fall prey to seeing certain statistics and limiting the amount of research that I should do on a player. I’m certainly not perfect! In 2020, Shane Bieber is likely going to prove or disprove my theory that his secondary pitches can help mask his fastball.
That’s something that I believe (although I admit I am biased to believe it), and it is something that I will learn from, one way or another. That’s what this is all about. Learning, and then getting better. Rinse and repeat. As I see it, the goal is to avoid the pitfalls of confirmation bias, improperly using advanced statistics, and to always be willing to be wrong and learn. There are several ways to skin a cat. I don’t think there’s a right way, but I do think there’s a wrong way. Make sure you don’t skin your cat that way. (And hopefully not literally.)
Featured Image by Justin Paradis (@freshmeatcomm on Twitter)
Glossary request:
One thing that BaseballHQ does really well is explain to you what is good and what is bad. On a pitch-by-pitch level, is there any way we can get a write up of what is, say a 25th percentile and a 75th percentile on some of these metrics?
You mention 94MPH as a threshold—with the caveat that it depends on spin rate? What kind of spin would we like to see if we’re below 94 MPH?
You mention that 10% Swinging strike rate is good for a fastball and for offspeed stuff we’re looking for that 15-40-40 threshold… But then you mention that Heaney’s 12% or so Swinging Strike Rate on his sinker is league-high? A 75th percentile on swinging strike, o-swing and zone rate for each pitch would be very helpful.
An addition to our very helpful glossary on, frankly, all of the stats would be a massive help. It’s good to know that O-Swing Rate is “How often a batter swings at a pitch that wasn’t located in the strike zone”… but that doesn’t really help someone understand what is a good O-Swing rate—especially when it varies between pitches so much.
Keep producing the awesome content. Cant exaggerate how helpful you all have been. I learn so much every day!