


Pitcher List is proud to partner with DraftKings for the 2019 season. We’ll be featuring our top picks for every daily slate through the season and feature articles dedicated to the GPP.

In addition to our regular previews of the upcoming slates on DraftKings, every Sunday we will be reviewing a featured contest from the prior week. Daily fantasy players often get caught up in the cycle of preparing for the current day, building lineups, making last minute changes, watching the games, and following their winnings, without taking a step back to look at what strategies were effective for the day’s contests. We will try to shed some light on winning plays and trends, as well as see where players went wrong.
DraftKings Free MLB Opening Day Contest, 3/29, Total Prizes: $1,000
When preparing to enter any daily fantasy contest, the first step should always be to analyze the structure of the tournament. This freeroll featured the following payout structure:
| Rank | Prizes Awarded |
| 1st | $25.00 |
| 2nd | $20.00 |
| 3rd – 5th | $15.00 |
| 6th – 10th | $10.00 |
| 11th – 35th | $5.00 |
| 36th – 85th | $3.00 |
| 86th – 235th | $2.00 |
| 236th – 520th | $1.00 |
The typical strategy for tournaments, or GPPs, is to play lineups that give you a shot at first place, or at least a high finish. As you can see, playing safe and just trying to finish in the money will only reward you with a dollar or two in this tournament, and that is typically not a winning formula in the long run for GPPs. This was a unique tournament, however. Leading up to the first pitch, you should have noticed the number of entries, and compared it with the number of places that finished in the money. We ended up with 939 entries in the tournament, and with 520 places paid out, over 55% of all players finished in the money. This structure allowed you to play this freeroll almost like a 50/50 or double up, where you pick a safe high-floor lineup in order to simply finish anywhere in the money. I wouldn’t fault you for still playing to win first place, but those who played safe lineups likely found it fairly easy to pick up a free $1-$2, as some of the high-risk lineups failed. This is a unique tournament structure but is a good lesson in how to attack contests on a case by case basis.
Winning Lineup Analysis
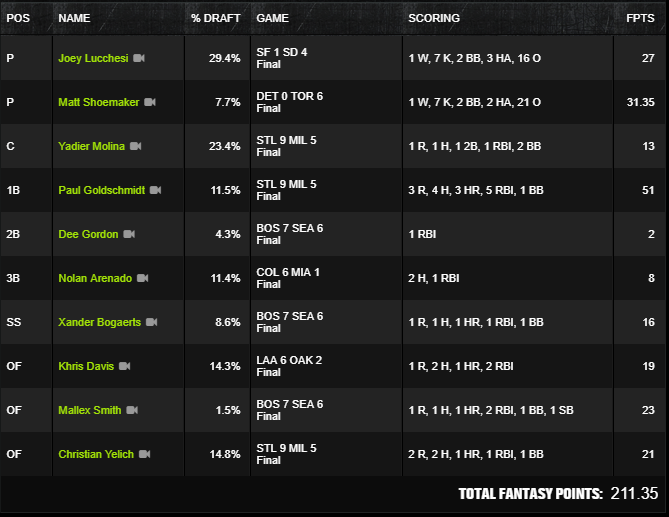
It should come as no surprise to see that the winning lineup featured Paul Goldschmidt. With an ownership percentage of 11.5%, Goldschmidt was the 17th most owned hitter in the contest, making his 51-point payoff even larger. Those researching the slate likely saw that opposing pitcher Freddy Peralta only allowed a .185 wOBA against right-handed batters last year, and may have shied away from Goldschmidt. This should serve as a reminder of the dangers of relying on small sample sizes, as Peralta came into the year with only 78.1 Major League innings under his belt. Peralta lasted only 3 innings in this start and allowed two doubles and a home run to right-handed batters, nearly matching his totals from all of last year. In hindsight, Goldschmidt was batting second against an unproven pitcher in an above average offensive environment in Miller Park and should have been in more of our lineups.
The other standout player from the winning lineup was Matt Shoemaker. Shoemaker was owned in 7.67% of all lineups, making him the 8th most owned pitcher in the contest, and his 31.35 points were tops among all pitchers. There weren’t many signs that this type of game was coming from Shoemaker himself, but the matchup did provide a clue. The Tigers as a team had a .290 wOBA against right-handed pitchers last year, the second-worst split on the slate (behind only the Giants and their .285 wOBA against left-handed pitchers). It likely isn’t a coincidence then that the winning lineup also played Joey Lucchesi, as they were clearly targeting the weak teams. This strategy won’t always work, and the top-end pitchers provide a much more consistent return in cash games. But targeting mediocre pitchers against bad offenses may provide us with a chance to get under-owned pitchers with tournament winning upside.
Most of the other lineup selections are pretty obvious choices, as Christian Yelich, Khris Davis, Nolan Arenado, Xander Bogaerts, and Yadier Molina will almost always be good options at their respective positions. It does give you an idea of the lineup depth you can have when you hit on cheap pitching options. Mallex Smith and Dee Gordon round out the lineup in an interesting mini-stack, as Gordon batted ninth and Smith batted first. I wouldn’t recommend playing anyone batting ninth very often, so Gordon was a bit of a reach. But Smith was a smart play in hindsight, as his 1.5% ownership as a leadoff hitter helps set this lineup apart from the field even further.
My Lineup
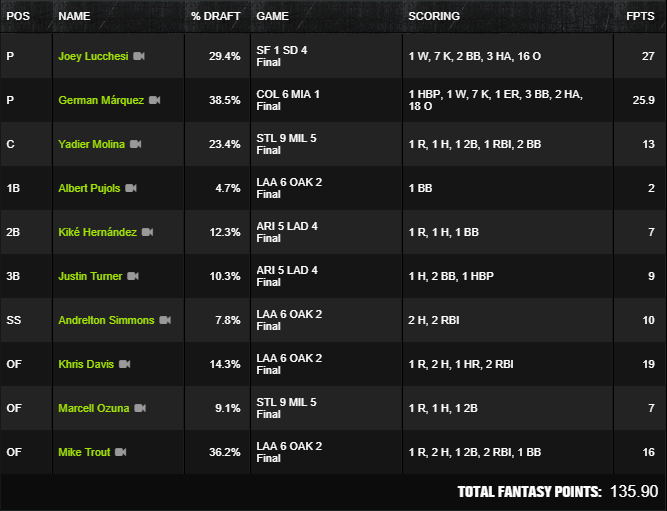
If you read my preview for this slate, you’ll see that I very much stuck to my recommendations. I chose to take more of a conservative approach considering the tournament’s structure, primarily looking to min-cash in this freeroll. With a 112th place finish and $2 win, I easily accomplished that goal. I shared Lucchesi, Molina, and Davis with the winning team’s lineup, and chose to go with an Angels stack, targeting Marco Estrada and his struggles against right-handed hitters. I actually rostered the four highest-owned players in the contest in German Marquez, Mike Trout, Lucchesi, and Molina, which might be something I need to reconsider in future lineups. But for the purposes of fielding a safe team that could finish in the top half of the field, these high owned players served their purpose.
Contest Overview
In the end, 101.15 points were needed to finish in the money in this DraftKings freeroll, while the first place lineup paced the field with 211.35 points. There were 224 different players rostered across the 939 entries. On an eight-game slate, you can see just how many different lineup possibilities there are. Below are some of the standout performances and disappointing duds from the contest. Be sure to follow me (@erikthered4444) and Pitcher List (@PitcherList) on Twitter for information on next week’s featured contest.
| Fewest $ Spent Per Point | |||
| Player | %Drafted | FPTS | Salary |
| Paul Goldschmidt | 11.50% | 51 | 4900 |
| A.J. Pollock | 6.71% | 33 | 4000 |
| Omar Narvaez | 2.88% | 19 | 2900 |
| Mallex Smith | 1.49% | 23 | 3800 |
| Yandy Diaz | 0.53% | 17 | 2900 |
| Domingo Santana | 3.41% | 21 | 3900 |
| Curtis Granderson | 1.28% | 18 | 3400 |
| Ryan Braun | 2.24% | 21 | 4200 |
| Mitch Moreland | 0.53% | 18 | 3700 |
| Christian Walker | 0.32% | 18 | 3700 |
| Highest Owned Disappointments | |||
| Player | %Drafted | FPTS | Salary |
| Mookie Betts | 19.49% | 3 | 5500 |
| Jose Altuve | 17.78% | 4 | 4400 |
| Alex Bregman | 16.51% | 0 | 4600 |
| Miguel Cabrera | 14.70% | 2 | 3700 |
| Nathan Eovaldi | 12.89% | -0.75 | 8500 |
| Lourdes Gurriel Jr. | 11.61% | 2 | 3700 |
| Jurickson Profar | 11.29% | 2 | 3800 |
| Jack Flaherty | 10.01% | 4.95 | 9000 |
| John Hicks | 9.05% | 0 | 2700 |
| Yasmani Grandal | 8.52% | 2 | 3900 |
I am a promoter at DraftKings and am also an avid fan and user (my username is eriks44) and may sometimes play on my personal account in the games on which I offer advice. Although I have expressed my personal views on the games and strategies above, they do not necessarily reflect the view(s) of DraftKings, and I may also deploy different players and strategies than what I recommend above. I am not an employee of DraftKings and do not have access to any non-public information.
Graphic by Justin Paradis (@FreshMeatComm on Twitter)