


It’s a great time to be a baseball fan. The first games of spring training are dotting MLB Network, while the last blasts of arctic air are coming through as winter draws to a close. That means that baseball season is around the corner, and for many, the next 30 days will be populated with a series of fantasy drafts that will dominate our time and attention.
At this juncture, draft preparation shifts from forming opinions on players through deep-level homework to analyzing where those players can be picked in drafts. After all, one can develop a favorable opinion on a player; however, that opinion might be rendered moot if that player is being overdrafted 40 picks above other comparable players.
The following article, the first in a series, will delve into five players whose ADPs are well below market, highlighted by a meaningful comparison to a similar player who is going much higher in drafts. Note that all subsequent ADPs were garnered from the Fantasy Pros ADP consensus chart.
Additionally, if you like this type of content, be sure to also check out Kevin Dalby’s “Bargain Bin” series. He recently posted the top ADP values for the catcher position and will be covering a new position each week.
Uptown Funk
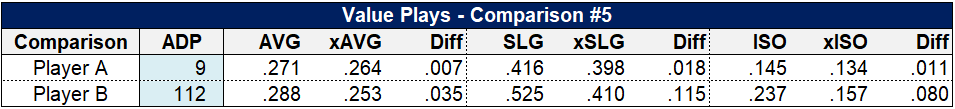
We’ll lead off with my favorite comparison to date. Both players were selected within four spots of each other in the 2005 MLB draft, yet they are being taken 10 rounds apart in 2019 fantasy drafts.
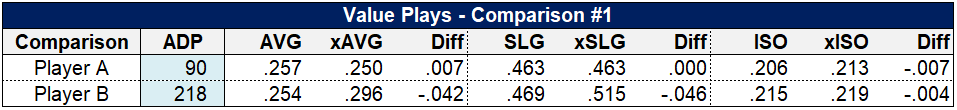
Player A is a counting-stat monster, routinely putting up 165 R+RBI/30 HR/10 SB every season. This consistency has earned him the admiration of fantasy owners, and some could argue that he represents a strong buy at his current ADP of 90. Amazingly, this consistent hitter has already been on five teams in his 11-year MLB career but seems to have found a long-term home with his most recent.
Father Time is slowly creeping up behind Player B, but in 2018 he posted his best xStats season since 2015, buoyed by a top-10 finish in xAVG and exit velocity on fly balls and line drives. Despite this impressive performance, the BABIP gods frowned upon Player B in 2018, casting him with a batting average 42 points below his expected number. Those results should regress positively going forward, which, combined with an offseason swing change aimed at hitting more fly balls, could result in a renaissance 2019. Injuries and playing time are a concern for Player B, but his team’s offseason moves favor him receiving more at-bats.
The AVG/SLG/ISO lines of both players were identical in 2018, despite Player B absorbing some serious bad luck. While you could be perfectly content picking Player A at his current draft slot, snagging a similar, if not better, rate stat earner 128 picks later represents a far better value.
Player A: Justin Upton
Player B: Ryan Braun
Thirds Please
Our second comparison features two young power hitters. They are both about the same age (26-27) and hit from the right side.
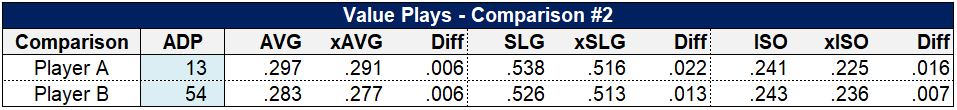
Player A was a highly regarded prospect who has grown into his own at the MLB level over the last three years. He is one of baseball’s most complete hitters, hitting for power, average and displaying an increasingly patient approach. Player A also projects stolen base value, but his performance there is inconsistent from year to year. Given this player’s well-below-average sprint speed, it’s likely that his stolen bases will decline. Despite these positive attributes, Player A is likely overvalued in drafts due to name.
Player B has been underrated for several years but finally broke out in a big way in 2018. He was a top-10 hitter in baseball according to Baseball Prospectus’ new DRC+ statistic, finishing the season with a robust .283/.366/.526 triple-slash. Some might question if Player B’s breakout was legitimate, yet his xStats support the overall story, with a .373 xwOBA in line with a .377 wOBA. Giving additional support to the legitimacy of his numbers, Player B is equally adept against all pitch types (.355 to .384 xwOBA against fastballs, breakers and offspeed) and shows powers to all fields.
Player A is going in the early second round, next to names like Ronald Acuna Jr. and Chris Sale. I’d suggest grabbing one of them and investing in Player B four rounds later.
Player A: Manny Machado
Player B: Eugenio Suarez
Old Wise Men
Our next comparison features two outfielders, both of whom maintained their effectiveness in 2018 despite getting a bit long in the tooth.
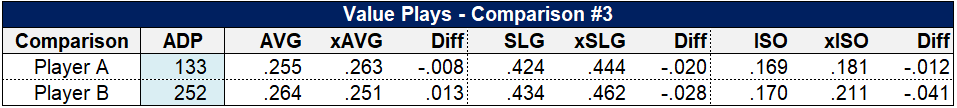
Player A is a former MVP and one of the most recognizable players in baseball, which is likely driving his elevated 133 ADP. This player’s plate discipline allows him to get on base at a well-above-average clip (.368 in 2018), and he’s a good bet for 20 HR/10 SB each season. The combination of on-base skills and a solid power-speed combo gives Player A a safe floor; however, there are plenty of players being drafted behind him who could offer similar value.
Player B is an even better on-base specialist, with a career 12.2% walk rate and .377 OBP. Yet, for some reason, he gets overlooked every season. This player has the injury-prone tag but has managed back-to-back 630+ plate-appearance seasons. Despite getting a bit unlucky in regard to his power output last year (-.041 ISO-xISO), Player B still bashed 21 home runs. The manager of Player B suggested he will likely serve as the team’s leadoff hitter this season, providing additional plate appearance opportunities and better pitches to hit.
A 252 ADP for a career .377 OBP player with a 20-home run floor is as good of a bargain as you’ll get.
Player A: Andrew McCutchen
Player B: Shin-Soo Choo
Gangly Outfielders
Our fourth value play compares a pair of long-limbed outfielders who hit for a strong average.
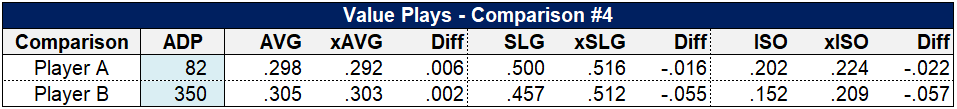
Player A has several years of plus offensive production under his belt, and possibly even more upside, but he is likely being overdrafted at 82. Player A also plays for a team that will assuredly be bad in 2019, limiting the positive run and RBI effects garnered by hitting in a good lineup.
Player B is one of the most underrated hitters in the game and possesses the highest xAVG among all MLB hitters over the last two years. Despite his strong .305 batting average in 2018, Player B suffered from some poor home run luck, evidenced by a -.057 differential between his ISO and xISO. However, the combination of being a late bloomer and playing for an NL team with a deep bench has scared people off.
Player B’s current ADP is a laughably low 350. While there are some concerns for playing time in 2019, the cream tends to rise to the top, and I have full confidence that he will turn in a strong season and reward fantasy owners with significant surplus value over their investment.
Player A: Nicholas Castellanos
Player B: Jose Martinez
Speed Demons
Our final comparison is a bit unique, as these players play different positions but present similar, speed-predicated skill sets.
Player A has been a consensus first-round fantasy draft pick over the last couple of seasons, though his underlying batting performance wasn’t anything to write home about, with a sub-.800 OPS each of the last two seasons. Fortunately, this player makes up for his lack of power with blazing speed, swiping 89 bases since 2017. He also hits atop a strong lineup and amassed an astounding 742 plate appearances in 2018. In spite of this, using a first-round pick on a player whose value is so tied to his batting order positioning and his speed is risky.
While Player A is an infielder, Player B is an outfielder. He owns sprint speed that ranked in the 95th percentile of MLB players in 2018. Exercise caution with the stats listed above, as they came in a mere 66 plate appearances last September, however Player B is a highly touted prospect who has a good shot at producing strong MLB numbers in 2019. Derek Carty’s THE BAT system projects a .279/.348/.450 triple-slash for Player B, compared to .280/.342/.443 for Player A. In terms of stolen base potential, Player B swiped 22 bags across 292 plate appearances at all levels last season. The projection systems suggest a range of 24 to 28 steals in 2019; however, those systems likely don’t reflect the fact that Player B’s team was one of the most steal-happy in baseball in 2018.
Player A and Player B actually play on the same team and could hit next to each other in the lineup. While it’s likely Player A outproduces B, the gap won’t be nearly as much as their 103-pick differential suggests.
Player A: Trea Turner
Player B: Victor Robles
(Photo by Jay Anderson/Icon Sportswire)
Very interesting comparisons and it is persuasive when you see these data points side by side! Thanks for making me consider a couple of players differently. Great work Nick!
Sorry but this article is super shady. Allt of these comparisons involve players who cannot be relied on for full time play against those that can or guys who have value tied up in stats you didn’t even bother including.