


Of all the newfangled sabermetric pitching statistics, FIP is one of the simplest.
According to FanGraphs, FIP is “a measurement of a pitcher’s performance that strips out the role of defense, luck, and sequencing, making it a more stable indicator of how a pitcher actually performed over a given period of time than a runs allowed based statistic.”
https://gfycat.com/agileobeseamericanshorthair
Defense independent pitching metrics are important.
FIP is scaled to resemble ERA, but instead of earned runs allowed, the inputs for FIP are strikeouts, walks, hit-by-pitches, and home runs. These inputs were chosen because they are the only results of a plate appearances that are not influenced by defense or timing.
With that in mind, FanGraphs uses FIP to estimate what a pitcher’s ERA would look like “if the pitcher were to have experienced league average results on balls in play and league average timing.”
FIP stands for Fielding Independent Pitching, a perfectly reasonable name for a statistic that aims to measure a pitcher’s performance without being influenced by the defense that played behind him.
But here’s the thing: FIP is not fielding independent.
Let me explain.
FIP Is Not Fielding Independent
The basic formula for FIP looks like this:
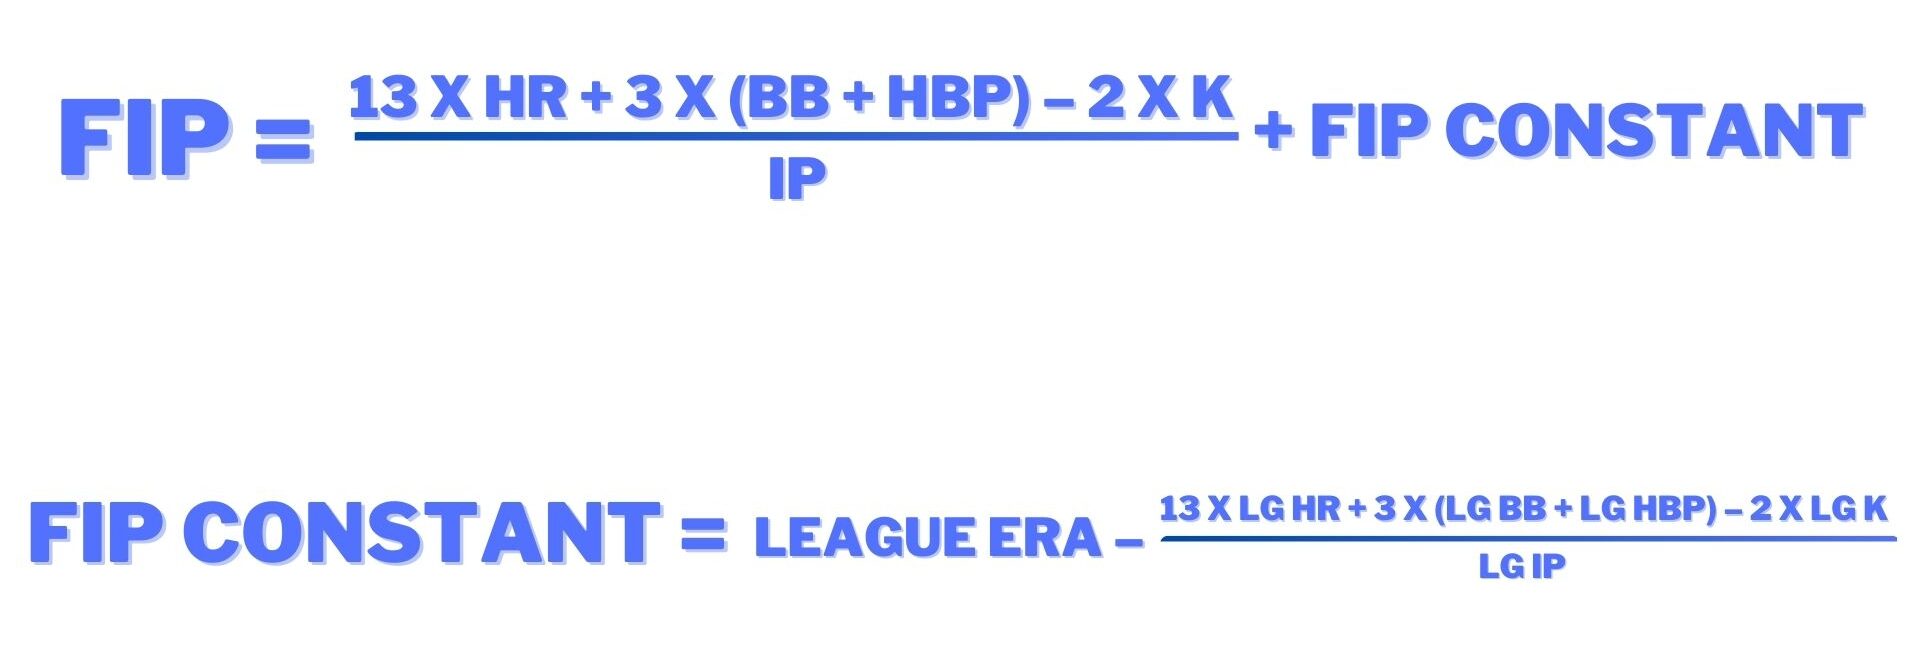
As you can see, innings pitched are a factor in calculating both FIP and the FIP constant (which is used to make sure FIP is always on the same scale as ERA).
If the total of 13xHR + 3x(BB+HBP) – 2xK is positive, it will get smaller when divided by IP. If the total is negative, it will get bigger when divided by innings pitched. That’s just what happens when you divide an integer by another integer.
This means for most pitchers, the more innings they throw, the lower their FIP will be (because 13xHR + 3x(BB+HBP) – 2xK is usually positive). For elite pitchers, the more innings they throw, the higher their FIP will be. Either way, innings pitched influence the final calculation of Fielding Independent Pitching.
Yet innings pitched are not “fielding independent”. How could they be?
Innings pitched are measured by how many outs are recorded with the pitcher on the mound. Outs, more often than not, are recorded by fielders. The more batted balls the defense turns into outs, the shorter an inning will be. And the more outs the defense records, the more innings a pitcher can throw.
Innings pitched influence FIP. Fielders influence innings pitched. Ergo, fielders influence FIP.
In other words, Fielding Independent Pitcher is not so fielding independent after all.
Finding a Way to “Fix” FIP
Fielding Independent Pitching may not be an accurate name for this statistic, but that does not mean the stat itself is without merit. FIP still does a good job of predicting a pitcher’s future ERA, and it is a helpful way to compare and contextualize a pitcher’s strikeouts, walks, HBP, and home runs.
Therefore, I’m inclined to find a way to “fix” FIP. How can we make it so that FIP is genuinely independent of fielding without altering this familiar stat beyond recognition?
In order to remove innings pitched from the equation, we need to replace that number with something else. FIP needs a denominator in order to be a rate stat rather than a counting stat. There needs to be a variable to represent the total amount of work a pitcher has done.
One option for a fielding-independent denominator is batters faced. Contextual FIP (or cFIP), a more advanced version of FIP, already uses batters faced instead of innings pitched. Batters faced is a much stronger denominator, because it more accurately measures the amount of work a pitcher has done rather than just the total number of outs recorded while he was pitching.
However, the amount of batters a pitcher faces can still be influenced by the defense playing behind him. For that reason, it’s not a perfectly fielding-independent denominator either.
If we’re looking for a perfectly fielding-independent denominator, then the answer we’re looking for has actually been right in front of us the whole time.
Strikeouts, walks, HBP, and home runs are the only results of a plate appearance that are not influenced by defense or luck on balls in play. That being the case, those four numbers should be the only inputs used to calculate FIP. A plate appearance that results in a ball in play should not influence FIP in any way.
Therefore, instead of innings pitched, the ideal FIP denominator is HR+BB+HBP+K. This sum roughly represents the total amount of work a pitcher has done, and it is uninfluenced by the defense that played behind him.
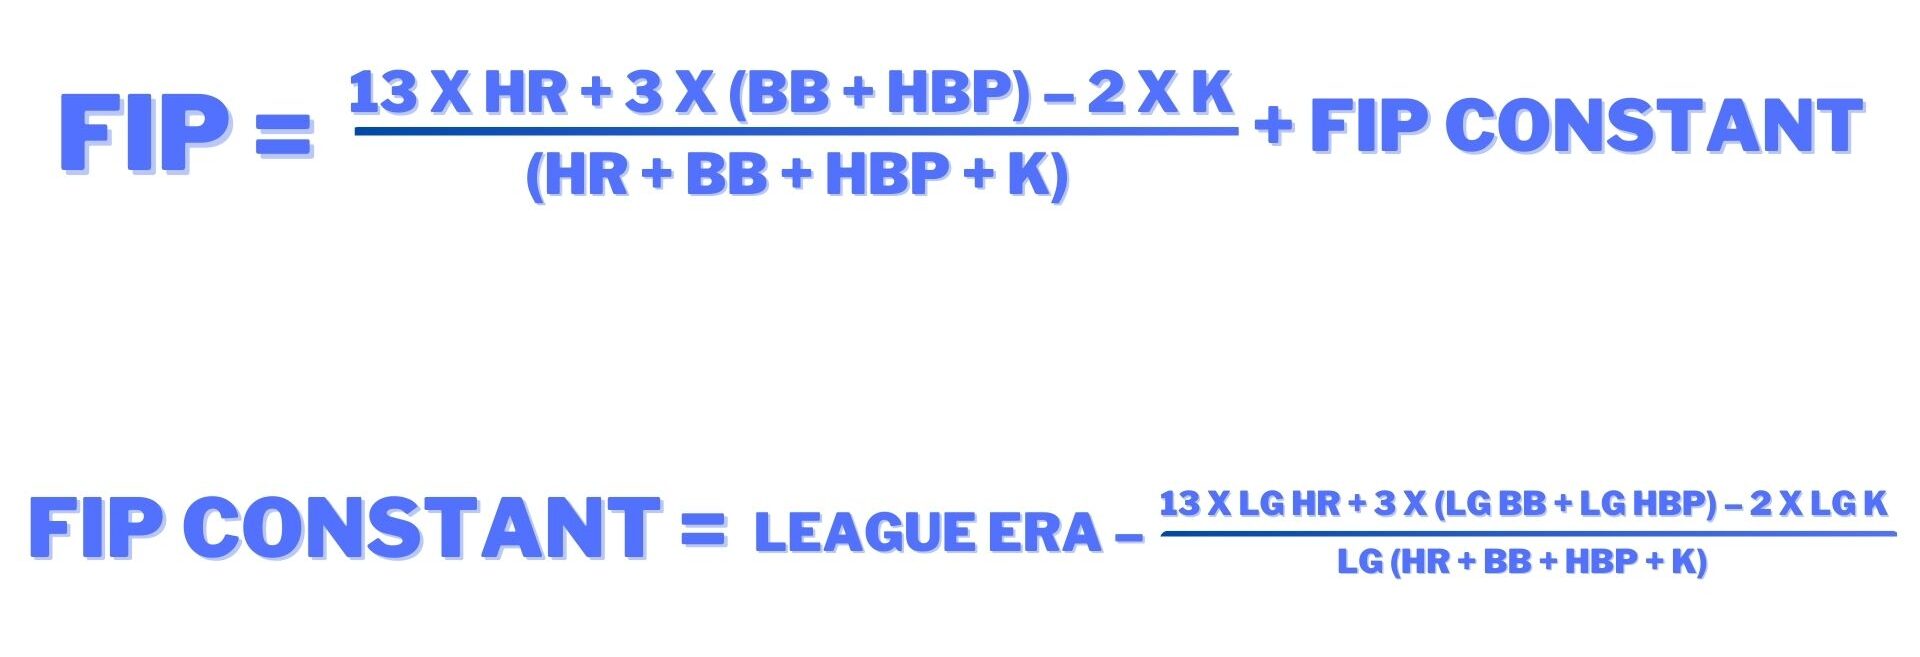
This same denominator will also replace total league innings pitched when calculating the FIP constant. And thanks to the FIP constant, this new version of FIP will remain on the same scale as ERA.
Does It Make a Difference?
By replacing innings pitched with the new denominator, the formula for FIP is genuinely independent of fielding. That’s awesome.
But here’s the next question: does it make any difference?
In terms of language, it matters quite a bit. A statistic called Fielding Independent Pitching should not be influenced by defense.
Practically speaking, however, does the new denominator change anything? There is a very high correlation between innings pitched and HR+BB+HBP+K – pitchers who throw more innings are going to accumulate more strikeouts, walks, HBP, and home runs. With that in mind, it would not be too surprising if this new denominator did not change the FIP leaderboards at all.
To test this, I used my new formula to calculate FIP for every pitcher with over 100 IP in 2021. I see the irony in using innings pitched as my cut-off point, but I just needed some way to limit the pool of pitchers I was looking at, and innings pitched was the easiest option. Cut-off points are always a little arbitrary anyway.
Here is a table with the results. I’m using the name gFIP (genuinely Fielding Independent Pitching) for my alternate version of FIP.
Overall, the 2021 gFIP leaderboard is very similar to the traditional FIP leaderboard – especially at the top.
Among the top 30 pitchers by regular FIP, nobody moved more than three spots in either direction using the new calculation. However, further down the leaderboards there is a little more movement. Antonio Senzatela, for instance, dropped from 32nd to 46th using gFIP, while Adam Wainright dropped from 35th to 44th.
Meanwhile, Blake Snell jumped from 48th up to 36th, while Cristian Javier jumped from 80th to 59th.
So, overall, although the FIP and gFIP leaderboards are not too different from one another, gFIP does make a meaningful difference for a handful of players.
As for the actual FIP and gFIP values, you can see that there is not a very big difference between the two numbers for most pitchers. Over 80% of the pitchers had a 2021 gFIP within 0.35 of their traditional FIP.
The players who did see the most significant difference between their FIP and gFIP were those at either end of the spectrum. Pitchers with a particularly low FIP were more likely to have a higher gFIP, and those with a particularly high FIP were more likely to have a lower gFIP.
In other words, gFIP seems to produce fewer results look like outliers. On the 2021 leaderboards, the difference between the highest and lowest gFIP is 3.15, while the difference between the highest and lowest FIP is 4.39.
Corbin Burnes had by far the biggest difference between his 2021 FIP (1.63) and gFIP (2.65). His gFIP is still elite (it remains the best in the league) but it is much less extreme. And because it is less extreme, it seems to be a more accurate ERA estimator than his FIP. Were I a betting man, I’d bet good money that Burnes’ 2022 ERA ends up closer to his 2021 gFIP than his 2021 FIP.
Indeed, my overall findings show that gFIP does seem to be a better ERA estimator than traditional FIP.
The Relationship Between gFIP and ERA
It’s far too early to determine the correlation between 2021 gFIP and 2022 ERA, so I turned to results from earlier seasons to prove this point. I looked at every pitcher with at least 100 IP in both 2017 and 2018, as well as every pitcher with at least 100 IP in both 2018 and 2019, and I found a stronger correlation between gFIP and the next season’s ERA than between FIP and the next season’s ERA. The correlation is only slightly higher, but it is higher.
There are a lot of numbers here, but all you really need to know is the R-squared value is higher and the RMSE is lower in the gFIP rows. That means gFIP is more strongly correlated with next season’s ERA than FIP is.
More extensive research is needed to see if gFIP is always better at predicting future ERA, but these initial results are very promising.
In addition, I found a stronger correlation between 2021 gFIP and 2022 projected ERA (using FanGraphs Depth Charts projections) than between 2021 FIP and 2022 projected ERA.
One of the main selling points of FIP is that it can predict future ERA more accurately than ERA itself. As it turns out, gFIP is even better than FIP at doing exactly that.
It’s Time to Put gFIP to Work
So, where does this leave us?
gFIP is better than FIP at being what FIP is meant to be: independent of fielding. gFIP is also better than FIP at doing what FIP is meant to do: estimate ERA.
Even so, gFIP only produces slightly different results than traditional FIP. The FIP and gFIP leaderboards look very similar, and gFIP is only a little bit better at predicting future ERA. Therefore, gFIP is not a brand new statistic. It really is just a slight improvement over the current FIP formula.
So, while gFIP is more accurate than FIP – both rhetorically and practically – it does not shake things up all that much. With that said, I only have one further question to ask: what are we waiting for? It’s time to put gFIP to work.
Featured image by Justin Paradis (@JustParaDesigns on Twitter)
Please hire a legitimate statistician or math guy.
This was actually quite interesting. If you use this again, I’d suggest adding a difference in pitcher rank if you use gFIP vs. FIP – this would be more meaningful/actionable as a relative number than abs difference vs gFIP
Thanks for sharing useful information. There are many metrics used in baseball, so you see all kinds of charts popping up after a season ends, either for individual or team analysis.
I think may also use FIP to judge a player’s performance by referring to statistics on the same scale as ERA.