


On April 16th, Alex Fast released an excellent article on a new metric called CSW. If you are unfamiliar with that stat I highly recommend that you check out Alex’s article before continuing. The formula for CSW is very simple:
Called Strikes + Whiffs
Total Pitches
It takes into account called strikes, swinging strikes (including blocked ones), swinging pitchouts, and foul tips into the glove, while excluding foul balls, then dividing by the total pitches thrown in an outing. One of the most interesting aspects of CSW is that it correlates with SIERA better than other commonly used metrics like called strikes, whiffs, and swinging strikes. Again, please read Alex’s article if you haven’t already.
Since the release of that article, I’ve noticed that CSW is getting a lot more attention (as it should!) on Twitter, podcasts, and the like. Now even very early on, one of the most asked questions was: “Is this stat team or league adjusted?” and early on the answer was no. However, after some discussions with Nick and Alex and them having to bear with many of my ramblings through the Discord group, we came up with a complimentary statistic called CSW+.
CSW+: A Compliment to CSW
In my attempts to develop a league and team adjusted companion to CSW, I went straight to FanGraphs. That site is one of the most informative places on the internet for baseball information and statistics. One of the most valuable (and I suspect under-utilized corners of the site) is the glossary section, where they outline the methods behind many of their statistics. I initially went directly to the wRC+ page because I figured that would be a good place to start, but after a bit more digging I came across the ERA-/FIP-/xFIP- page and decided to model CSW+ after those statistics. The formula for CSW+ is as follows:
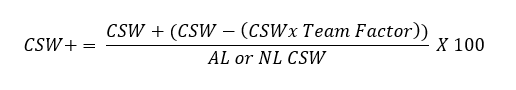
So yeah, if you are familiar with any of the pitching “minus” statistics, this should look very similar. The first thing to make clear here is that CSW+ is calculated per game pitched. That is due to the inclusion of the Team Factor, where the Team Factor is calculated as a team’s collective (batting) CSW divided by the league CSW (Note: The Team Factor is not league adjusted). There will be more examples and tables below, but as a quick example: As of May 15th, the Boston Red Sox batters had a CSW of 27.4% and the league average was 28.9%, so their Team Factor is calculated as follows: 27.4/28.9 = 0.948 (which can change slightly depending on how many decimal points you use).
CSW+: The Process
The thing I had the most difficulty with during this whole process is how to apply the Team Factor, since CSW will be dynamic with each game played and we don’t want to make it difficult to calculate. So initially here is how we will proceed:
- For our calculations of CSW+ we will use the daily updated CSW to calculate the Team Factor.
- We will update a community Team Factor and League adjustment on the 1st and 15th of each month going forward on the open source CSW sheet that Alex posts on Twitter each day.
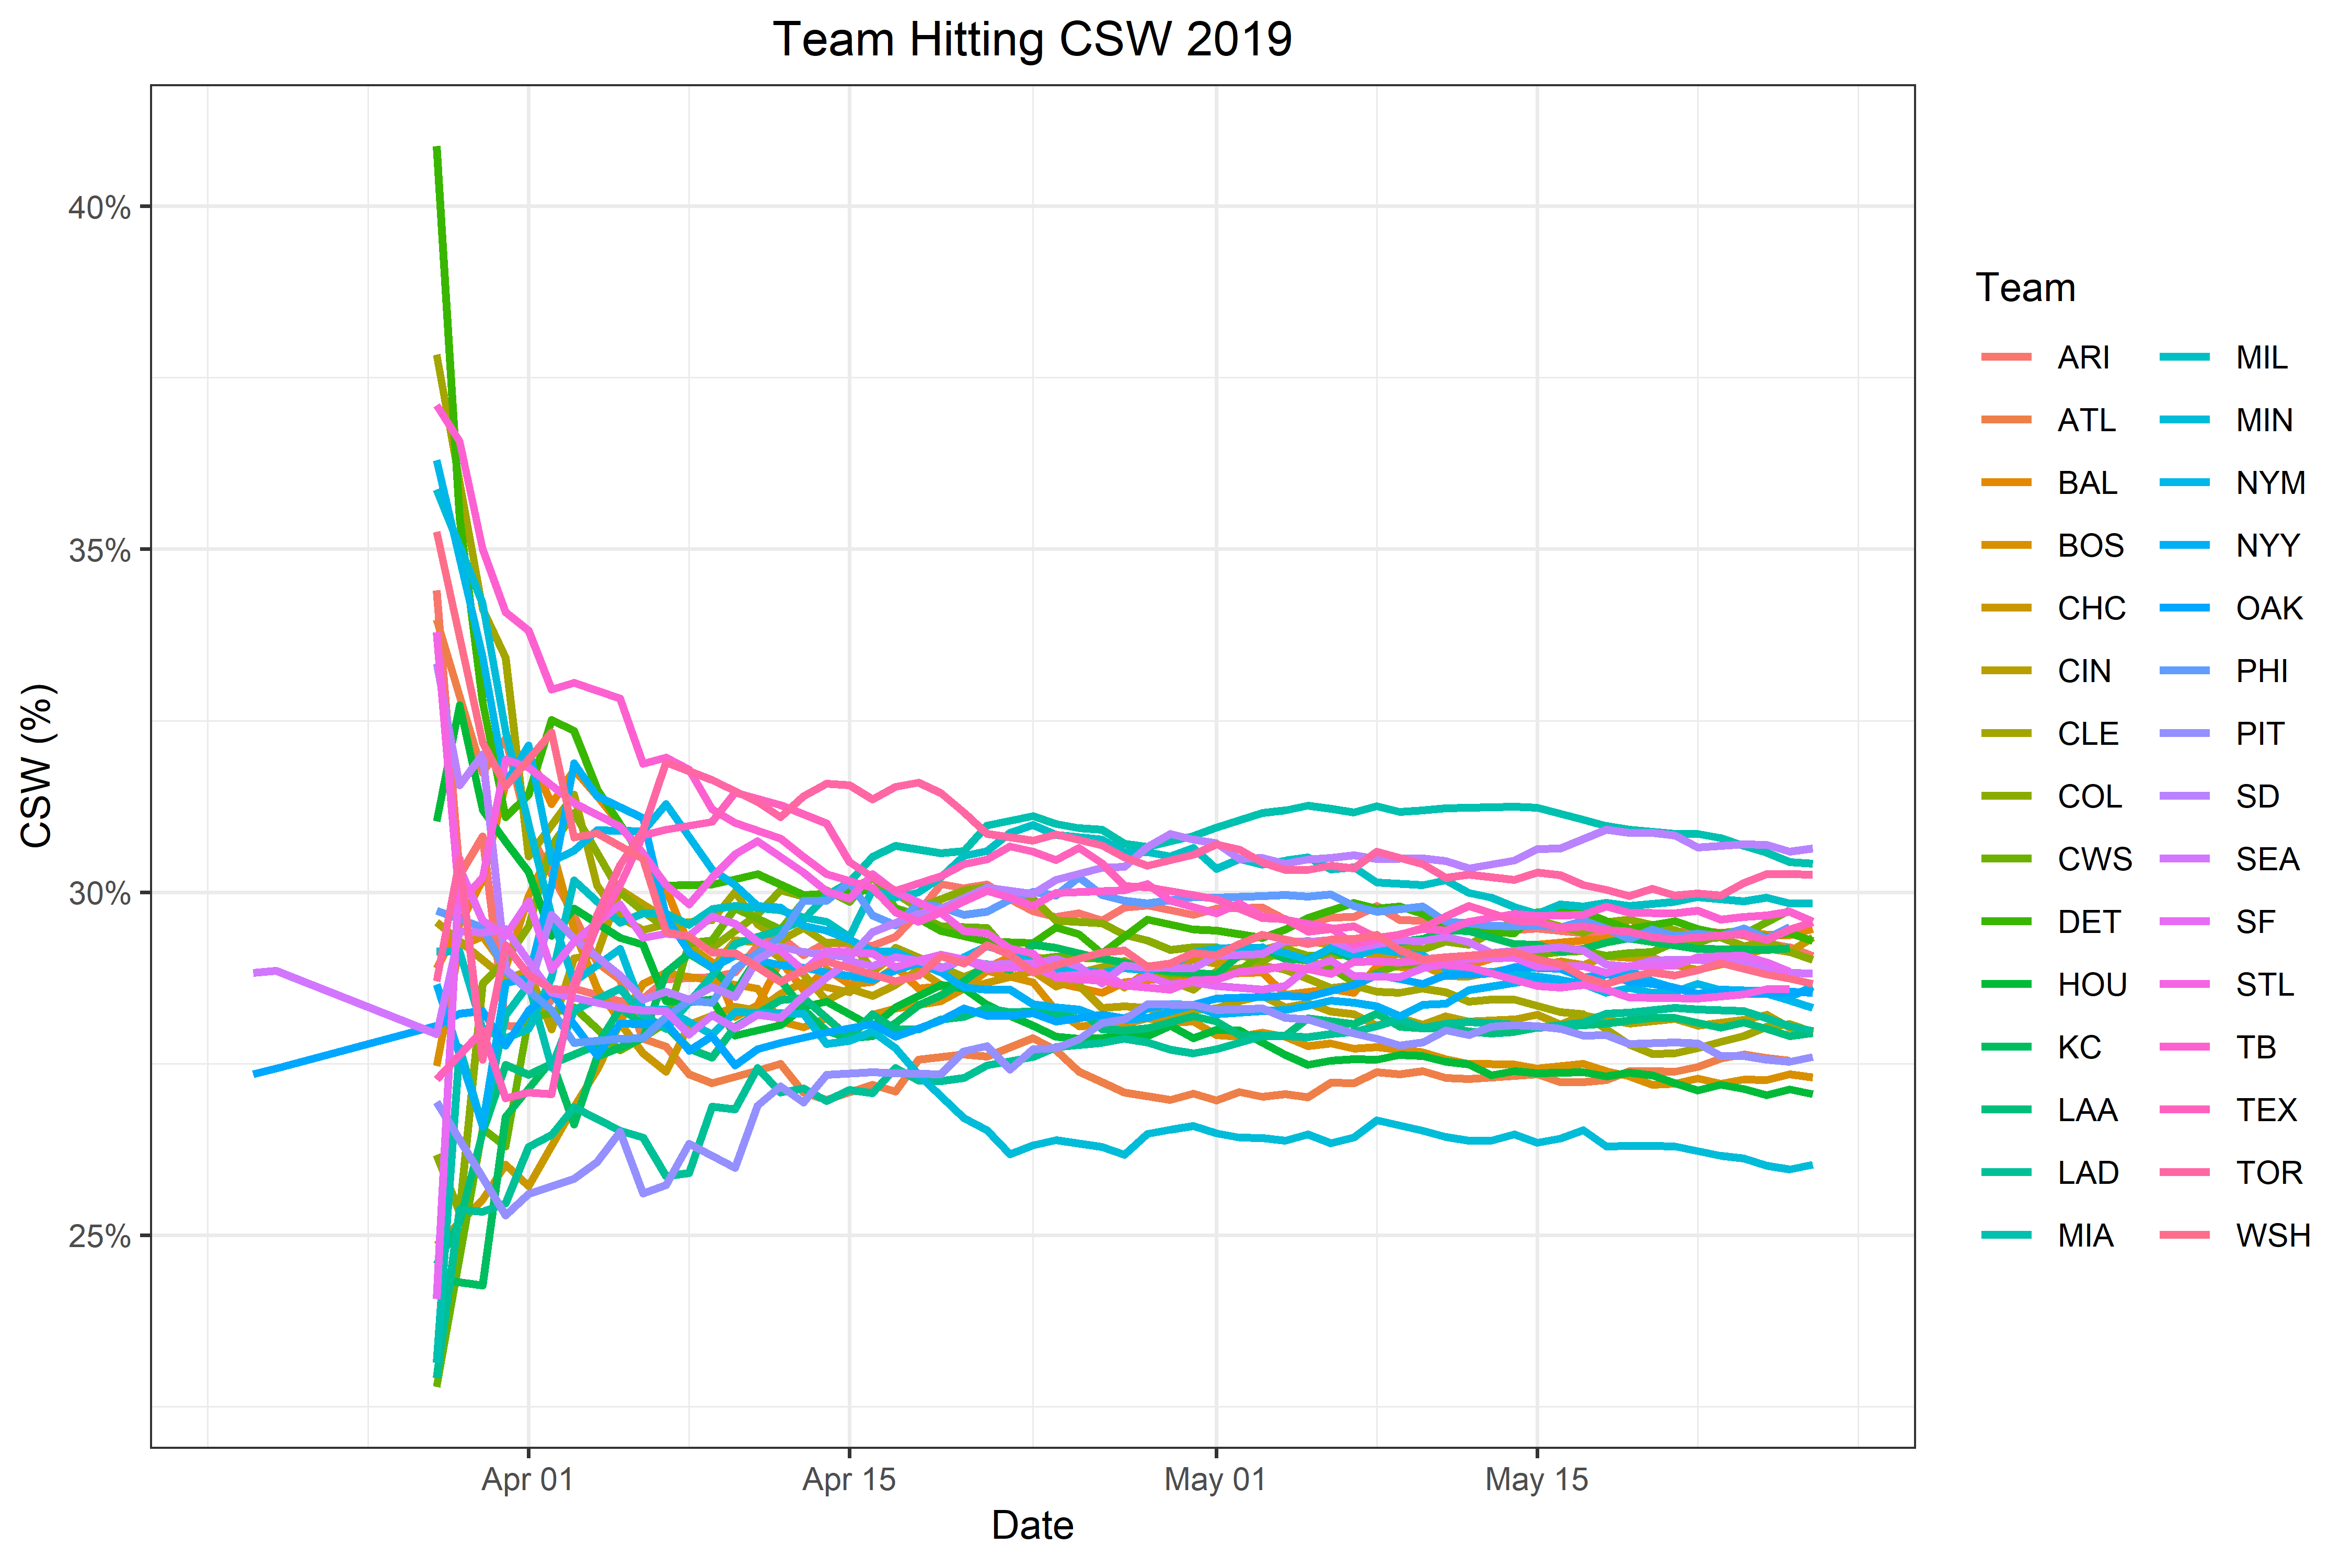
Taking a closer look at each team’s batter’s CSW in the 2019 season, it seems as though the things may have stabilized already. So I’m guessing that updating the Team Factors twice per month should suffice for the time being.
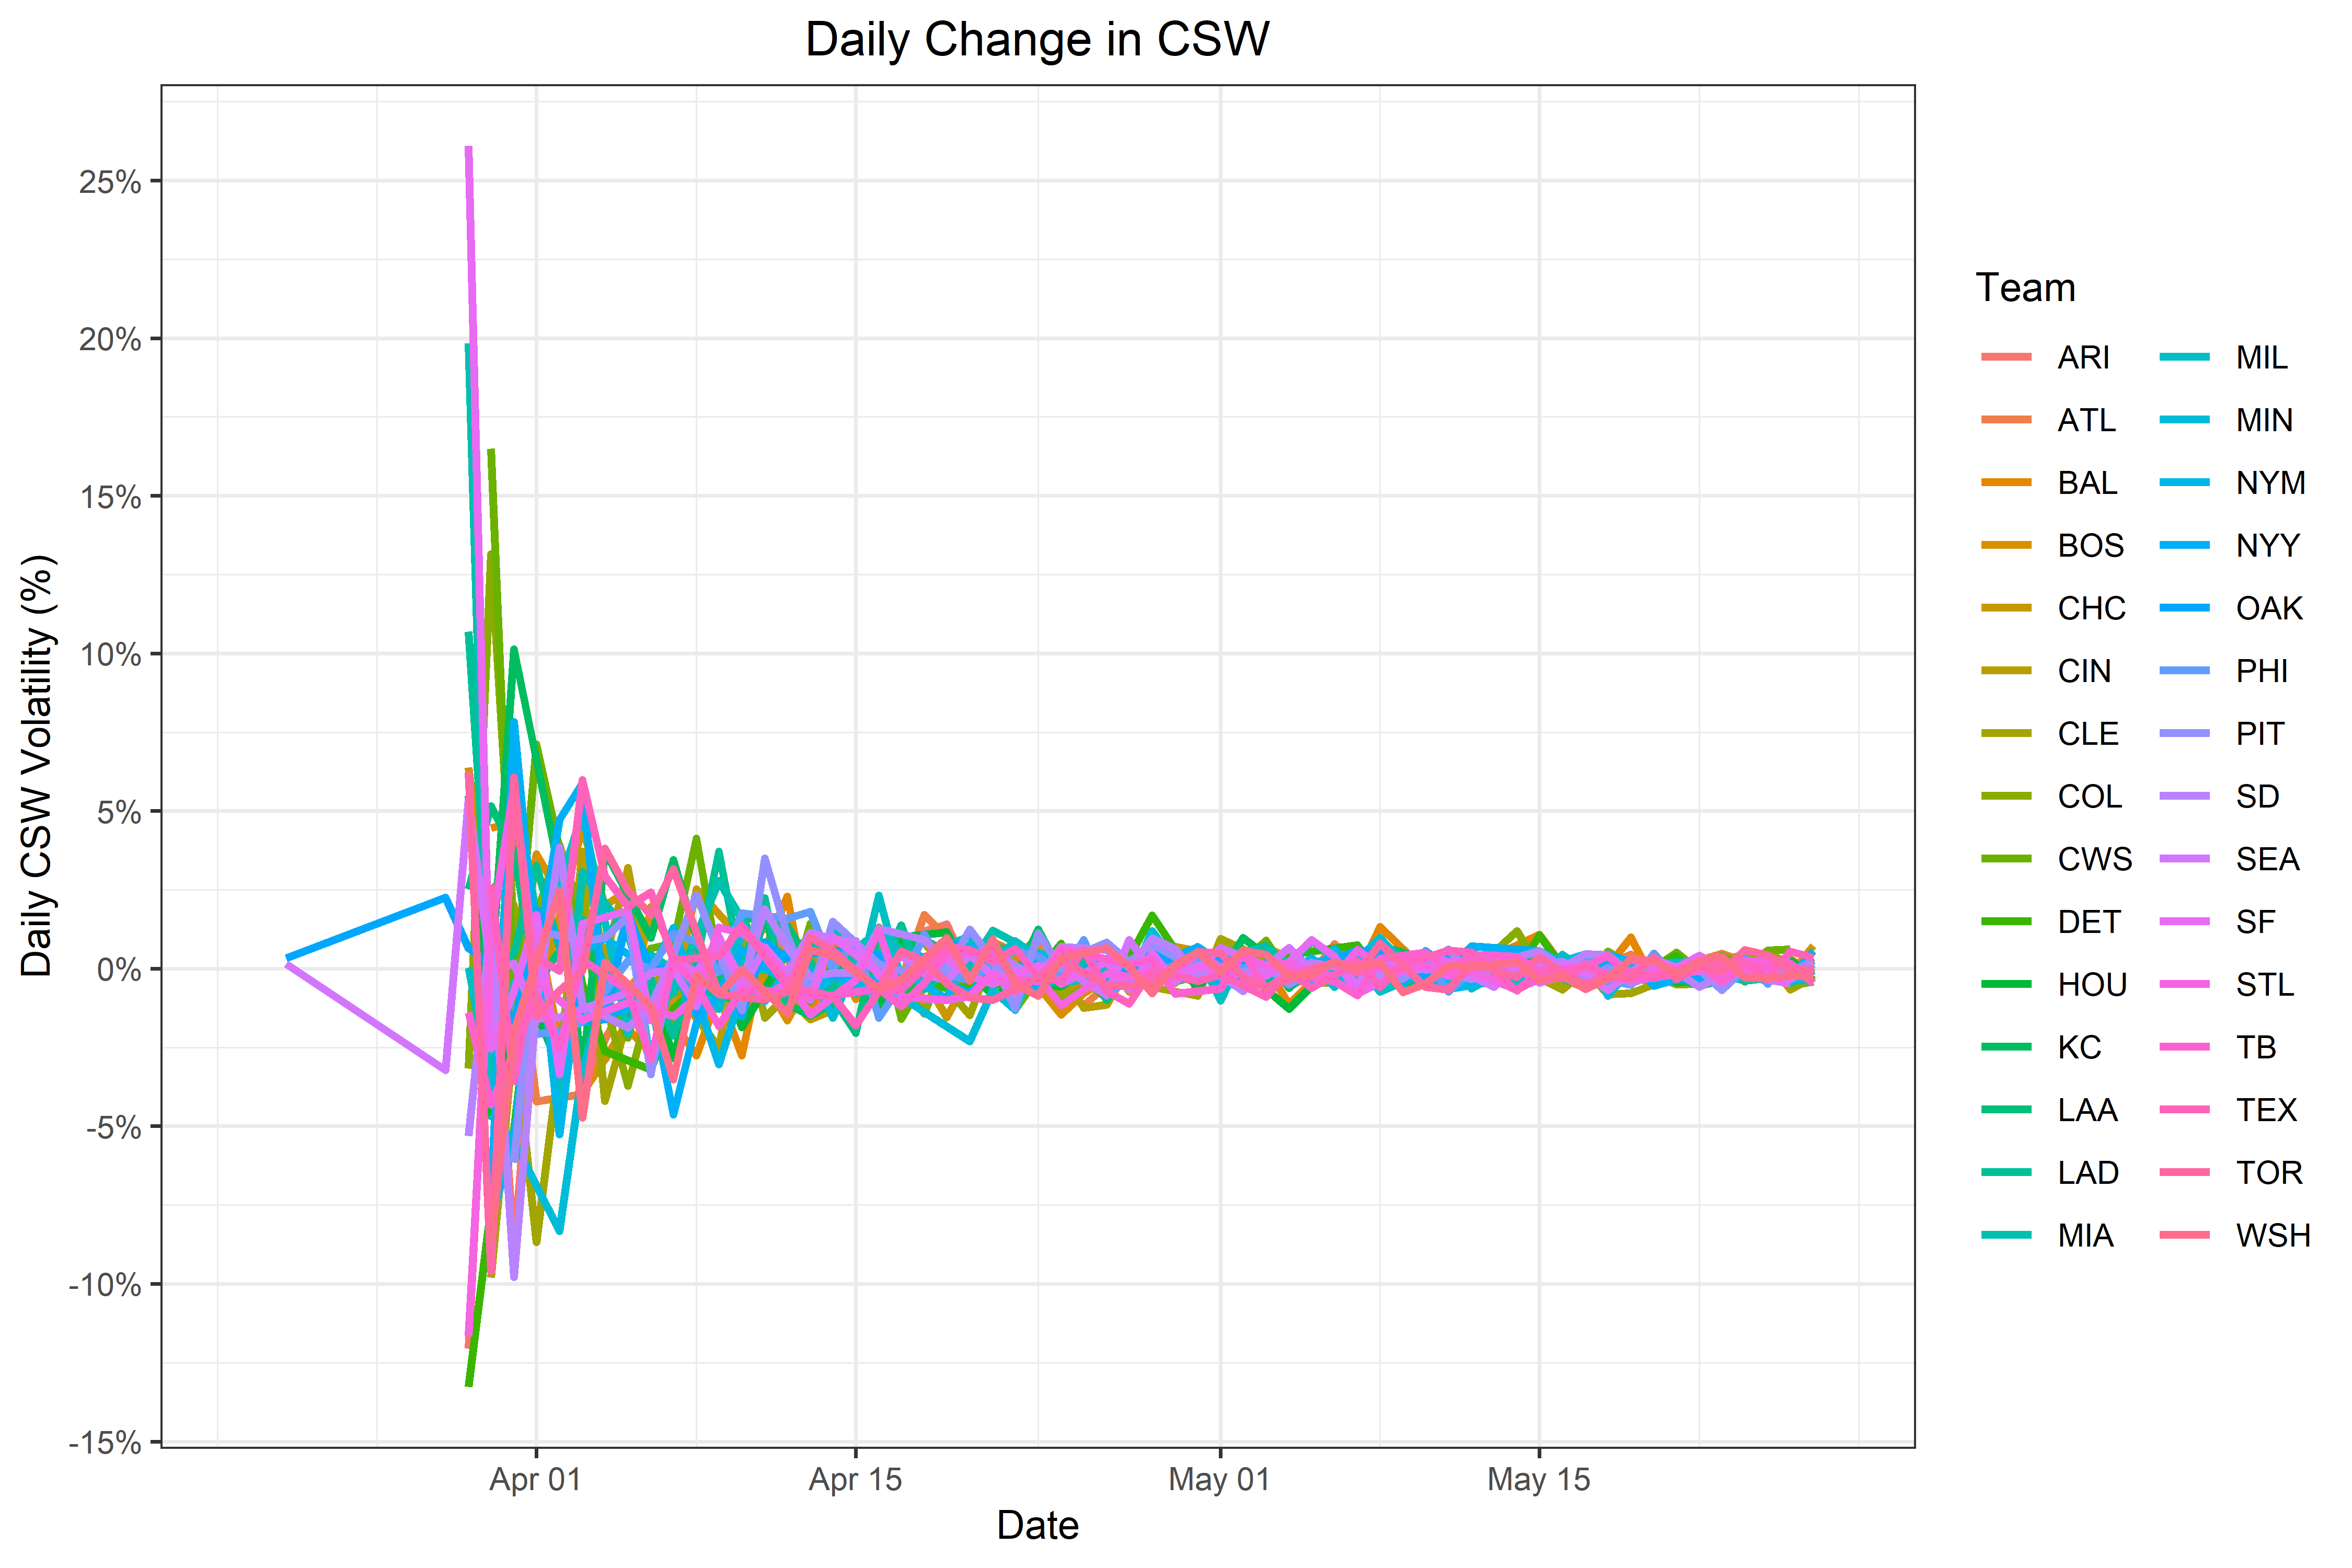
Let’s also take a closer look at a single team, we’ll use the Toronto Blue Jays as an example here, to see how much variability there is we see in daily CSW. The CSW reported is a cumulative CSW (e.g. in the first game the Jays posted a 28.7% CSW, in the second game was 31.9%, but the average between the two was 30.48%). By the 25th game of the season, the daily CSW was changing by about 0.5%, and at this point in the season (about game 50), that has dropped to about 0.3%. I suspect that we have reached our stabilization point, but I don’t have any stats to back that up.
| Game Number | Team | Game Date | CSW | % Change |
|---|---|---|---|---|
| 1 | TOR | 2019-03-28 | 28.70370 | NA |
| 2 | TOR | 2019-03-29 | 30.48780 | 6.216 |
| 3 | TOR | 2019-03-30 | 27.55906 | -9.606 |
| 4 | TOR | 2019-03-31 | 29.23077 | 6.066 |
| 5 | TOR | 2019-04-01 | 28.79257 | -1.499 |
| 23 | TOR | 2019-04-21 | 30.84848 | -1.007 |
| 24 | TOR | 2019-04-23 | 30.75581 | -0.300 |
| 25 | TOR | 2019-04-24 | 30.84452 | 0.288 |
| 26 | TOR | 2019-04-26 | 30.68427 | -0.520 |
| 27 | TOR | 2019-04-27 | 30.50804 | -0.574 |
| 46 | TOR | 2019-05-19 | 29.94195 | -0.308 |
| 47 | TOR | 2019-05-20 | 30.05243 | 0.369 |
| 48 | TOR | 2019-05-21 | 29.95176 | -0.335 |
| 49 | TOR | 2019-05-22 | 29.98014 | 0.095 |
| 50 | TOR | 2019-05-23 | 29.94987 | -0.101 |
Below is an extension of the table we just saw, except that it contains the daily change in CSW for each team.
CSW+: League and Team Factor
We are going to keep this section short and sweet. We see that the NL has a slightly higher CSW compared to the AL:
| League | League CSW |
|---|---|
| AL | 28.4% |
| NL | 29.1% |
And here are the Team Factors as of May 15th. We can see that teams like the Miami Marlins, San Diego Padres, and the Blue Jays post the highest CSW rates and the Minnesota Twins, Atlanta Braves, and Houston Astros are on the lower end. I want to reiterate that the Team Factor is calculated from a team’s hitters, not pitchers.
| Team | CSW | TeamFactor |
|---|---|---|
| MIA | 31.2% | 1.081 |
| SD | 30.6% | 1.060 |
| TOR | 30.3% | 1.048 |
| DET | 29.7% | 1.028 |
| MIL | 29.7% | 1.027 |
| TB | 29.7% | 1.026 |
| COL | 29.6% | 1.024 |
| TEX | 29.6% | 1.023 |
| PHI | 29.5% | 1.022 |
| ARI | 29.5% | 1.020 |
| BAL | 29.2% | 1.012 |
| KC | 29.2% | 1.012 |
| SEA | 29.1% | 1.009 |
| CWS | 29.1% | 1.006 |
| WSH | 29.0% | 1.004 |
| CHC | 28.9% | 1.001 |
| SF | 28.9% | 1.001 |
| OAK | 28.9% | 1.000 |
| NYM | 28.8% | 0.996 |
| NYY | 28.7% | 0.994 |
| STL | 28.6% | 0.991 |
| CLE | 28.4% | 0.984 |
| CIN | 28.2% | 0.976 |
| PIT | 28.1% | 0.971 |
| LAD | 28.0% | 0.970 |
| LAA | 28.0% | 0.970 |
| BOS | 27.4% | 0.949 |
| HOU | 27.4% | 0.947 |
| ATL | 27.3% | 0.946 |
| MIN | 26.3% | 0.912 |
CSW+ in Action
Enough with the theory and the calculations. We all know you’re here to see this sucker in action. Here are the results from May 23rd, 2019:
| Batting Team | Pitching Team | Game Date | Pitcher | CSW | CSW+ |
|---|---|---|---|---|---|
| WSH | NYM | 2019-05-23 | Steven Matz | 35.2% | 120 |
| CHC | PHI | 2019-05-23 | Aaron Nola | 34.4% | 117 |
| NYY | BAL | 2019-05-23 | Dylan Bundy | 34.1% | 120 |
| COL | PIT | 2019-05-23 | Jordan Lyles | 33% | 111 |
| HOU | CWS | 2019-05-23 | Lucas Giolito | 32.7% | 121 |
| CLE | TB | 2019-05-23 | Ryan Yarbrough | 32.3% | 117 |
| CWS | HOU | 2019-05-23 | Corbin Martin | 31.8% | 109 |
| SF | ATL | 2019-05-23 | Kevin Gausman | 31.8% | 108 |
| ATL | SF | 2019-05-23 | Madison Bumgarner | 31.4% | 112 |
| BAL | NYY | 2019-05-23 | Masahiro Tanaka | 30.5% | 104 |
| MIA | DET | 2019-05-23 | Matthew Boyd | 29.4% | 94 |
| TOR | BOS | 2019-05-23 | Ryan Weber | 28% | 94 |
| LAA | MIN | 2019-05-23 | Martin Perez | 27.3% | 98 |
| PHI | CHC | 2019-05-23 | Jon Lester | 26.2% | 88 |
| DET | MIA | 2019-05-23 | Trevor Richards | 25.3% | 86 |
| TB | CLE | 2019-05-23 | Adam Plutko | 24.1% | 82 |
| NYM | WSH | 2019-05-23 | Stephen Strasburg | 18.8% | 65 |
| PIT | COL | 2019-05-23 | Antonio Senzatela | 14.9% | 53 |
Now let’s highlight two pitchers from the table and go through the calculations:
Game CSW: 33%
Team Factor (Opponent): 1.024 (Rockies)
NL CSW: 29.1%
CSW+ = ((33 + (33 – (33*1.024))) / 29.1) * 100 = 111
Game CSW: 32.7%
Team Factor (Opponent): 0.947 (Astros)
AL CSW: 28.4%
CSW+ = ((32.7 + (32.7 – (32.7*0.947))) / 28.4) * 100 = 121
And here we go: an interesting result. Even though Lyles posted a higher CSW, his CSW+ is lower than that of Giolito. This is because Giolito did it against a much tougher opponent. The Colorado Rockies hitters have posted a higher than average CSW rate, while the Astros are well below league average. Also notice that Giolito had the best performance of the night when using CSW+ despite posting the fifth best CSW rate. Even with just this one example, we can see how CSW+ can inform us relative to opponent quality.
Conclusion
Almost immediately the community asked for a standardized CSW, and I really hope we delivered. As was the case with CSW, CSW+ should only be used on a micro level to see how pitchers performed over a single start. Future work will consist of the next steps with be to calculate a season long CSW+ for each pitcher. Perhaps that will be as simple as taking a mean of a pitcher’s CSW+ from each start. That is a problem for later, but in the meantime maybe someone out there will take it upon themselves to explore more of what the CSW family of metrics has to offer.
Featured Image by Justin Paradis (@freshmeatcomm on Twitter)
Commenting only to say I love the work you guys do. Great job on CSW and CSW+
Thanks so much, really appreciate that
This is great. I always have a hard time trying to remember what’s good for CSW, so that makes my life a lot easier. It would be cool if eventually you guys could make leaderboards.
There is an open source CSW that Alex Fast had been maintaining this year. I don’t know if a leaderboard is in the cards this year, but Nick has said that the next version of PL will be the year of stats. So maybe next March
Hi, so this will be updated with CSW+?
https://docs.google.com/spreadsheets/d/1_MPAPbhgHNSOaikT9u6jANbde0iBoCXSH1VX0C8RyFM/edit#gid=2073415862
Thanks!
I hope so! Once Alex gets back from his vacation, we will talk about how we can have CSW+ updated. For the time being, I will be posting the daily CSW and CSW+ on Twitter
Awesome, thanks for this!
The CSW and CSW+ formulas assume that called and swinging strikes have equal value. I wonder if this is true, and if the formula might be improved if a swinging strike was weighted a bit more than a called strike.
Thanks for the comment. Alex and I have had this conversation as well. Hopefully we can come up with a solution to properly weigh a called strike versus a whiff and release a wCSW in the future
This is awesome data, but it’s entirely possible to enhance the stat with the CSW rate for each player in a given lineup, not the Team avg CSW. For example, in Giolito’s performance vs. the Astros I believe Springer and Correa did not play (or something like that). If a pitcher’s individual performance is to be praised the actual lineup construction he faced should be accounted for.
That is a fantastic idea. Calculating the CSW for each batter would be fairly straightforward, and you’re right it would be more reflective on who the pitcher actually faced. I have a few other things on the go right now, but I will keep this in mind. Thanks for the comment.