


The Los Angeles Dodgers have been one of the best teams of the last half-decade or so, and they finally got their World Series championship in 2020. While they’ve gotten close in prior years, one of the things that pushed them over the edge this season was them acquiring yet another star-level player. This player, of course, being Mookie Betts.
Add Betts into the fold with other star-level offensive players such as Cody Bellinger, Corey Seager, and Max Muncy, and is quite clear to see why they have been so dominant in recent years, and why they’re likely to continue trending that way in the future. The Dodgers are not a team without their stars, on both sides of the ball. Heck, they’re even interested in adding another star, as if they don’t have it good enough as it is.
No one would call Chris Taylor a star, and the point of this post is not going to try and convince anyone that he is. Taylor has been, however, a quiet and steady producer for the Dodgers since the 2017 season, and he even took a step forward this past season to become even more than that. Taylor is most known for his seemingly out-of-nowhere breakout season in 2017 in which he posted a .288/.354/.496 triple slash, for a 126 wRC+ and 4.8 fWAR.
That is certainly impressive on its own, but even more so considering where he had been at the plate in the majors in earlier seasons from 2014 to 2016, where he was the polar opposite of his 2017 line with a 69 wRC+ bouncing around between the majors and minors in the Seattle Mariners organization, then the Dodgers, in 2016.
Taylor followed that up with a 3.1 fWAR and 113 wRC+ season in 2018, which is comfortably solid, but not quite matching up to his 2017 breakout. His 2019 season was closer to league-average, and still a useful player, but as more time passed from that 2017 season, the more it began to look like that season was more of a one-off.
In the abbreviated 2020 season though, Taylor was quite fantastic. On the year, Taylor slashed .270/.366/.476, good enough for a 131 wRC+, with a .364 wOBA to go along with it. This was all while Taylor was hitting ninth most often for the Dodgers, which is more of a testament to just how stacked the team was this season. Taylor also came into the year without an expected everyday role, likely fulfilling more of a utility or super-sub role, which would not quite be the ideal circumstance to set career-best numbers.
Well, his play in 2020 definitely kept him in the lineup most days for the Dodgers, as he appeared in 56 of the team’s 60 regular-season games, as well as the vast majority of their postseason games.
This was a different version of Taylor in 2020 than the one we have come to know over the past few seasons and even a different one than the 2017 version that burst onto the scene. Taking a look at some expected statistics, Taylor’s 2020 stands out as the best in many categories:
| Season | xBA | xOBP | xSLG | xISO | xwOBA | xwOBACON |
|---|---|---|---|---|---|---|
| 2017 | 0.275 | 0.344 | 0.458 | 0.183 | 0.349 | 0.435 |
| 2018 | 0.245 | 0.327 | 0.420 | 0.175 | 0.330 | 0.431 |
| 2019 | 0.242 | 0.317 | 0.405 | 0.163 | 0.309 | 0.393 |
| 2020 | 0.268 | 0.365 | 0.481 | 0.213 | 0.354 | 0.431 |
It’s pretty clear that 2020, with all of the usual small sample caveats that go with it, looks to be the best for him, at least in terms of expected stats. Even during his breakout 2017 season, it didn’t appear that StatCast bought in fully, while in 2020 StatCast seems to be more of a believer.
Speaking of, Taylor’s StatCast profile in 2020 looks a lot healthier than it ever has. His 2020 percentile rankings feature a lot red than in the past, including 2017, and in some pretty important metrics:
Taylor’s 2020 profile definitely looks good, especially when compared to his 2019. However, some of the blue in his profile still does not look too great. See a static shot of his 2020 profile for reference:
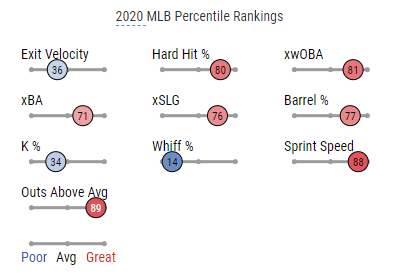
Sure, he is still swinging-and-missing a lot, which is leading to a lot of strikeouts, but curiously, he does have a blue indicator in one seemingly important metric: average exit velocity. It doesn’t quite match up with the rest of the snapshot, as a hitter would not normally be expected to have solid expected slugging or wOBACON marks with such a low average exit velocity mark. Adding an additional wrinkle to this is that Taylor’s hard-hit rate in 2020 was outstanding, as he landed inside the 80th percentile with a 45.0% rate. As a reminder, hard-hit balls are those hit 95 miles-per-hour or harder. So, Taylor did that exceptionally well, but all of those hard-hit balls weren’t enough to get impact his average exit velocity mark all that much. Taylor does stand out a bit when compared to the rest of the league when comparing average exit velocity to hard-hit rate:
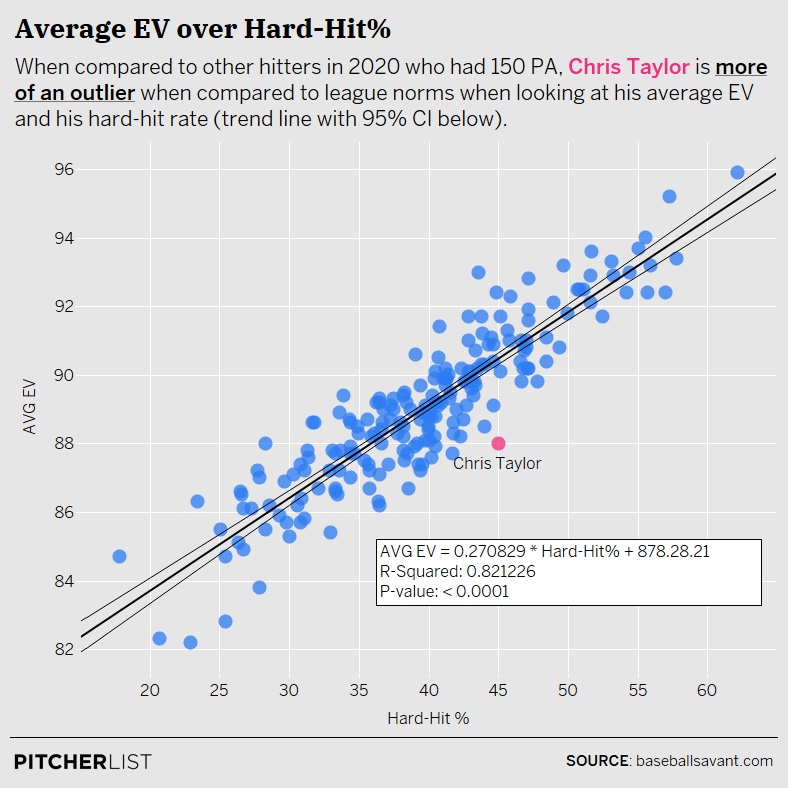
Data Visualization by @Kollauf on Twitter
From this plot, Taylor appears to be somewhat of a unique case, with the plot seemingly confirming that it is rather unusual for a hitter to have such a strong hard-hit rate but not an impressive average exit velocity mark. In the case of Taylor, it is key to remember how important it is to break out these exit velocity numbers by batted-ball type, and that average exit velocity on its own is not a perfect stat. It makes sense to say that it is more important to hit the better batted-ball types hard, meaning hitting line-drives and fly balls harder than grounders. Taylor appeared to get the memo in this department in 2020 because he hit his fly balls and line drives an average of 95.8 mph, a rate that ranked him 31st out of 203 hitters with at least 150 plate appearances in 2020. Now, that seems like a pretty good explanation for why Taylor’s hard-hit rate was so high. Creating the same plot as the previous one, but this time changing it to compare hitters hard-hit rates to average exit velocity on fly balls and line-drives Taylor gets shown in a more favorable light:
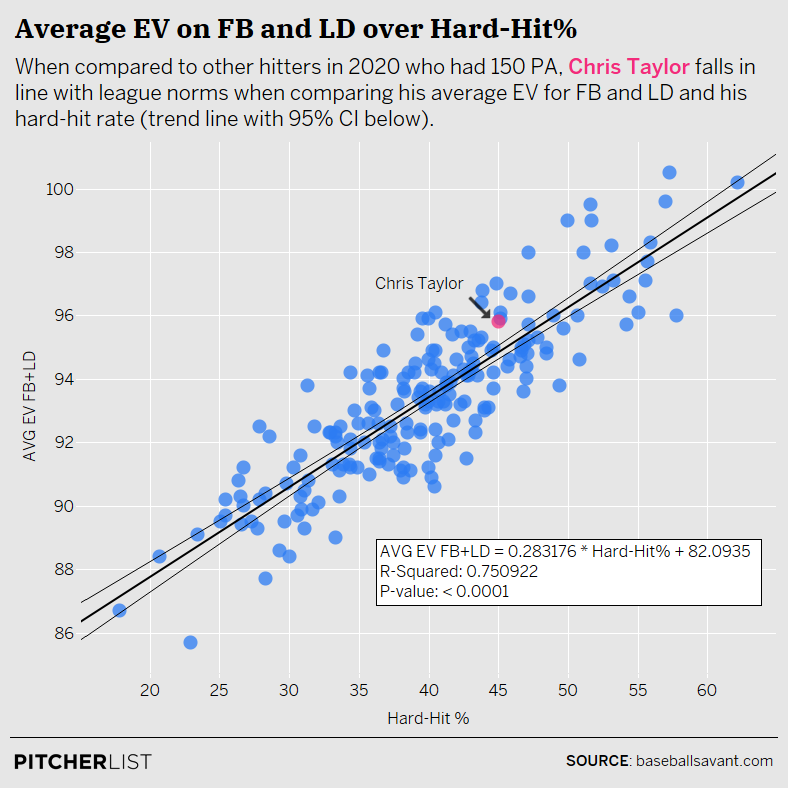
Taylor definitely looks like less of an outlier when comparing him to the rest of the league when looking at it this way. This also should be considered a positive, as it looked like Taylor was taking advantage of the better batted-ball types and maximizing his results on them. With a .652 wOBA and 1.094 slugging on these batted-ball types, Taylor did find himself towards the top of the leaderboard in both categories.
It was even more important for Taylor to do this because his groundball rate in 2020 was 48.1%, a new career-high and by far his highest rate since in his four post-breakout seasons going back to 2017. It is good to see that Taylor’s high groundball rate in 2020 did not affect him much because of the steps forward he took in getting the most out of his non-grounders, and doing some more digging on Taylor’s high groundball rate will also provide more clarity on his lower-than-expected average exit velocity mark.
Taylor did not get much help on all of those groundballs. The heavier dosage of groundballs that Taylor hit were generally hit extremely weak. See his average exit velocity broken out by batted-ball type:
| Batted-Ball Type | AVG EV |
|---|---|
| Groundball | 76.8 |
| Line Drive | 95.5 |
| Fly Ball | 96.5 |
This again shows just how good Taylor was at hitting his non-grounders, but also shows just how drastic the difference in contact-quality was when he was hitting grounders. Taylor’s 76.8 mph groundball average exit velocity was one of the ten lowest among all hitters in 2020. The combination of such a low average exit velocity on groundballs and his higher rate of groundballs hit helps explain why his overall average exit velocity mark came out lower than what would be expected when considering his high hard-hit rate. Overall, Taylor’s 19 mph difference in average exit velocity on fly balls and line drives to groundballs was the fourth-largest difference among hitters with at least 150 plate appearances, which seems to be quite significant.
Based on this, it was clearly important for Taylor to get the most out of his non-groundballs, which was exactly what he did. Not only was his average exit velocity on fly balls and line-drives among the best in baseball, but his results on fly balls in particular, were very encouraging, the most notable of which is his average fly ball distance. Take a look at the top-five hitters in terms of average fly distance from the 2020 season:
| Player | AVG FB Distance (ft.) |
|---|---|
| Nelson Cruz | 352 |
| Ronald Acuna Jr. | 352 |
| Chris Taylor | 345 |
| Marcell Ozuna | 342 |
| Teoscar Hernandez | 342 |
Some of the usual suspects are here, but seeing Taylor sandwiched between Acuna Jr. and Ozuna on the leaderboard is quite a surprise and not where he would be expected to be, but it is surely a welcome surprise. Taylor put on quite a show at times, and it is not so surprising when looking back and seeing him hit some true rockets like these:
Batted balls like that will definitely play, and Taylor doing more of that during the 2020 season was what helped him take a step forward, and get some of the best results of his career.
But how much stock should be put into this performance? While the 2020 version of Taylor is a great case study and endorsement for why we should look beyond just the surface-level StatCast metrics and why average exit velocity on its own is not the most important thing to look at, it remains to be seen if Taylor will be able to maintain and carry this performance into the future, which is ultimately what we care most about as the calendar shifts to 2021.
It was a good sign to see Taylor really hone in and crush his non-groundballs and get the most out of them, although this type of performance from Taylor remains one that will be tough to fully evaluate considering the circumstances surrounding the 2020 season. Was this just more so the result of a hot stretch or is this something to buy into?
Going back to 2017 and looking at Taylor’s results on fly balls and line drives, it’s clear just how much 2020 sticks out:
| Year | SLG | xSLG | wOBA | xwOBA | AVG EV |
|---|---|---|---|---|---|
| 2017 | 1.037 | 0.956 | 0.634 | 0.601 | 91.1 |
| 2018 | 0.907 | 0.863 | 0.561 | 0.568 | 92.4 |
| 2019 | 0.972 | 0.847 | 0.569 | 0.521 | 90.1 |
| 2020 | 1.094 | 1.141 | 0.652 | 0.650 | 95.8 |
While Taylor’s strong 2020 results seem to be backed up by expected stats, Taylor was never at this level in the past, and perhaps his 2020 numbers should be discounted a bit. When looking back on his 2018 and 2019 seasons, Taylor, while not bad in this department, did not quite stack up when compared to the rest of the league. Next, it should be kept in mind that Taylor’s groundball rate was nearly 50% this season. A regression in his fly balls and line drives combined with a groundball rate somewhere in the neighborhood of where it was in 2020 would suggest that some decline in his offensive numbers may be coming. Essentially, it would be expected that with slugging and wOBA numbers on his fly balls and line-drives resembling 2018 or 2019, with such a high rate of groundballs, Taylor would be a much different offensive player.
Of course, that is just a hypothetical. Nobody knows right now what Taylor will do at the plate next season. But, considering the track record and the limitations that the 2020 season brings when evaluating players, it remains unclear whether Taylor’s strong performance in 2020 will carry over to the next season.
That doesn’t exactly mean that it is all doom and gloom for Taylor, however. With his position versatility and high offensive floor, Taylor should still remain a solid, all-around contributor for the Dodgers next season. He is not the biggest star on the team, but he continues to fill his role and do it exceptionally well. His steps forward at the plate in 2020 were impressive, and he went above and beyond what would have been expected from him, but we will have to wait and see if that level of play can be replicated in a full campaign.
Photo by Peetlesnumber1 / Wikimedia Commons | Adapted by Jacob Roy (jmrgraphics3 on IG)
“Taylor’s 19 mph difference in average exit velocity on fly balls and line drives to groundballs was the fourth-largest difference among hitters with at least 150 plate appearances” who are the top 3? Sorry, I’m not sure where to find this. I wonder if he’s in good company there with other guys who overperform their avg exit velo.
Another note, was he taking more pitches and being more selective this year? I see his walk rate went up and his strikeout rate went down, and he had a career high Barrel %, so I’m guessing he did a better job of working counts and waiting for meatballs, but I don’t have the stats to back that up.
Another odd thing from looking at his statcast page, that the pitch he hits best (fastballs), he saw less of this year than other years. He’s definitely a unique case.
Hi Charlie, thanks for reading. For the leaders in biggest difference in average EV on FB+LD and GB, that was something I calculated manually. I can tell you that the top five largest differences in 2020 were 1. Joey Gallo 2. Cedric Mullins 3. Garrett Hampson 4. Chris Taylor and 5. Tyler O’Neill. Also inside the top-ten are Acuna, Grisham and inside the top-fifteen are Voit, Semien and, Soto, although most of these hitters aren’t heavy-groundball hitters, it is perhaps still significant to know that.
Taylor definitely was a bit more selective, as his chase rate declined over ten percentage points from 2019, which definitely helped his walk rate spike, although he did whiff more on pitches in the zone, which likely explains why his strikeout rate was still 25%.
Taylor is also part of a group of hitters that saw fewer fastballs than ever in 2020, that’s a good catch. His teammate, Max Muncy, is another case. It makes sense that pitchers are throwing fastballs less than ever, and especially when considering how well Taylor has hit them in the past. Will be interesting to see what happens if that rate of fastballs drops even further in the future.
Nice writeup, Matt. Will indeed be interesting to see how Taylor performs moving forward, as well as how the 2020 season is used for predictive evaluation
Thanks Conor, glad you liked it!