


One of the storylines that will be remembered about the 2021 season is the league’s mid-season decision to enforce its long-standing rules prohibiting the use of foreign substances on baseballs (Rules 3.01 and 6.02(c) and (d), specifically). The “sticky stuff crackdown,” as it came to be colloquially known, drew a lot of media attention, generated a public outcry from pitchers upset about having to change their ways on the fly in the middle of a season, and created a number of on-field spectacles when umpires performed inspections on pitchers. Despite a lot of negative publicity, the policy had the desired effect of reducing the spin pitchers could impart on the ball, which we know is strongly tied to pitch movement and swinging strikes.
At the league level, the raw spin rate of four-seam fastballs and curveball pitch types – the two pitch types that arguably benefit most from increased spin – had been steadily increasing since the 2015 implementation of Statcast technology in all the major league parks made granular tracking of this data widely available. Prior to June 3rd of this past season, when word started to leak out that the league was planning to start aggressively policing for foreign substances, the average spin rates on those two pitch types were the highest recorded:
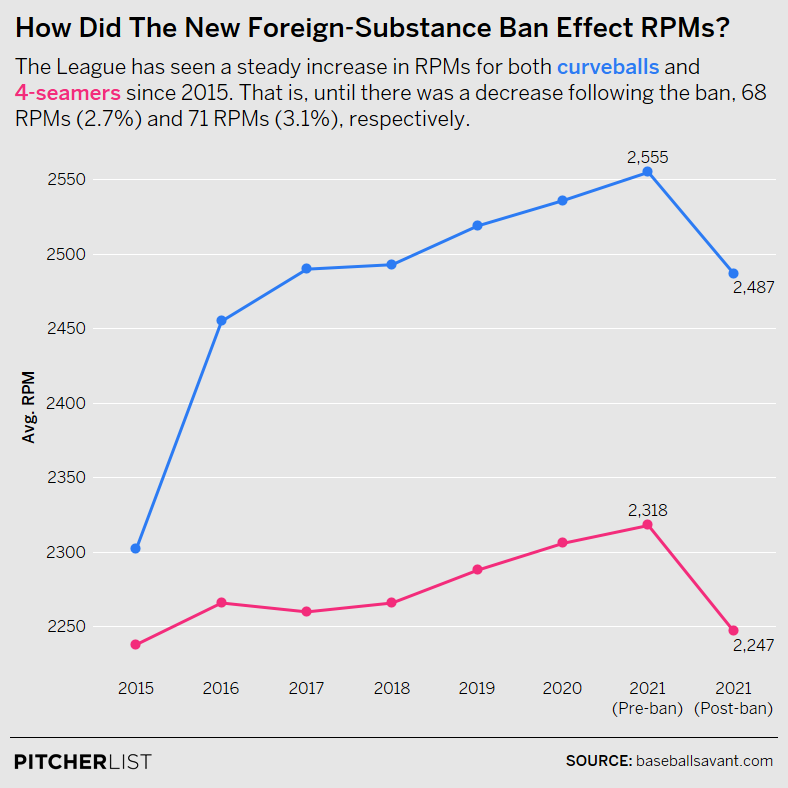
After June 21st, when routine in-game inspections of pitchers for foreign substances began, the average spin rates on four-seamers declined to near 2015 levels and the average curveball spin rates declined to near 2017 levels.
Since there is a positively correlated relationship between spin rate and velocity, it’s worth considering the data in the chart above in the context of velocity to confirm the spin rate change was not the result of a comparable decline in velocity. The chart below plots the seasonal league average spin to velocity (RPM/MPH) ratio of four-seam fastballs and curveballs:
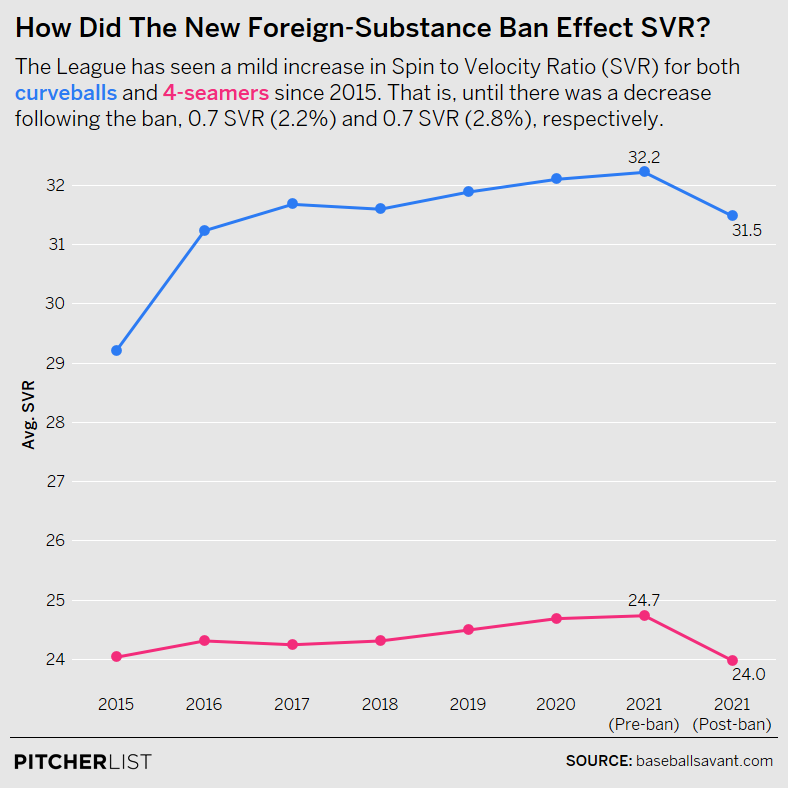
The data clearly shows that the spin to velocity ratio on both pitch types declined noticeably after June 21. In fact, the league average four-seam fastball velocity was the same – 93.7 MPH – before and after the crackdown and the league average curveball velocity decreased slightly from 79.3 MPH to 79.0 MPH. With these minimal velocity changes, the data suggests that the enforcement of the foreign substance ban effectively decreased the rate of spin pitchers could put on their pitches.
Reducing spin was merely a means to an end. The league’s real goal was to alter the balance between pitchers and hitters in hopes of increasing balls in play and action on the field. It clearly felt a good way to do that was to limit pitchers’ ability to spin the baseball and create movement. As spin went down, movement followed.
At the league level, per FanGraphs data, four-seam fastballs averaged 8.4 inches of vertical break prior to the ban and 8.2 inches after. Horizontal break on four-seamers changed from 1.7 inches to 1.6. Curveballs were affected more dramatically. Before the ban, the league average curveball had 7.6 inches of drop and 2.9 inches of horizontal break. After, those same figures were 7.0 and 2.2 inches. A few fractions of an inch might not seem that impactful, but when milliseconds make the difference between batter success and failure, every little bit helps.
The rule enforcement was successful in driving spin and movement down. Was it successful in increasing offensive production, and more importantly, balls in play? The data suggests “yes,” but only modestly:
Each of the stat categories in the table above moved in the league’s desired direction after the crackdown (right-hand column). Contact was up, leading to better batting and slugging rates. Swings and misses were down, leading to fewer strikeouts. These end-of-season numbers track with multiple more rigorous analyses (see Fangraphs, the Ringer, and Baseball Prospectus) conducted in July that controlled for the usual mid-season offensive production bump that accompanies the hot summer weather and other variables.
Reaction and Response
The ban succeeded in diminishing the pitchers’ advantage over hitters, but not in a dramatic way. As the others pointed out in the links above, the offense gained some ground, but only enough to get back to a level comparable to 2018 or 2019, not the mid-2000s.
In that sense and in hindsight, the actual impact of the crackdown feels a bit out of proportion with the emotional response it generated last summer.
Boston’s Garrett Richards made headlines when he publicly admitted that his dramatically decreased spin rates were causing him to introduce new pitches to his repertoire on the fly. “I’m figuring it out. I’m starting to throw a changeup now that I learned this week in about three days. Now I’m throwing a curveball at 60 miles an hour, which is new for me,” Richards said after a June game.
Tampa Bay ace Tyler Glasnow said that pitching without something to improve his grip had caused him to change the way he held his fastball and curveball. “I felt completely different. I switched my fastball grip and my curveball grip. I’ve thrown it the same way for however many years I’ve played baseball.” Glasnow also attributed his season-ending elbow injury to the mid-season change. “I woke up the next day and it was like, I am sore in places that I didn’t even know I had muscles in,” Glasnow said. “I just threw 80-something innings, and then you just told me I can’t use anything in the middle of the year?” he said. “I have to change everything I’ve been doing the entire season. Everything out of the window, I had to start doing something completely new.”
“And then I’m telling you, I truly believe that’s why I got hurt. Me throwing 100 and being 6-7 is why I got hurt, but that contributed.”
Yankees ace Gerrit Cole said following a start just before the enhanced enforcement went into effect, “[i]t’s so hard to grip the ball” and “[f]or Pete’s sake, it’s part of the reason why almost every player on the field has had something, regardless if they’re a pitcher or not, to help them control the ball.”
Given the amount of attention the ban got in the media and this sampling of headline-making quotes, you’d be forgiven if you assumed the enforcement of the rules had caused pitchers to make major, widespread changes in how they went about their business.
But, that’s not how it played out.
The chart below plots the share of all MLB pitches that Statcast binned as fastballs (four-seamers, two-seamers, sinkers, and cutters), offspeed pitches (changeups, splitters, forkballs), and breaking pitches (curveballs, knucklecurves, slow curves, eephuses, and sliders) over the past seven seasons, with 2021 split into before June 3 and after June 21 buckets:
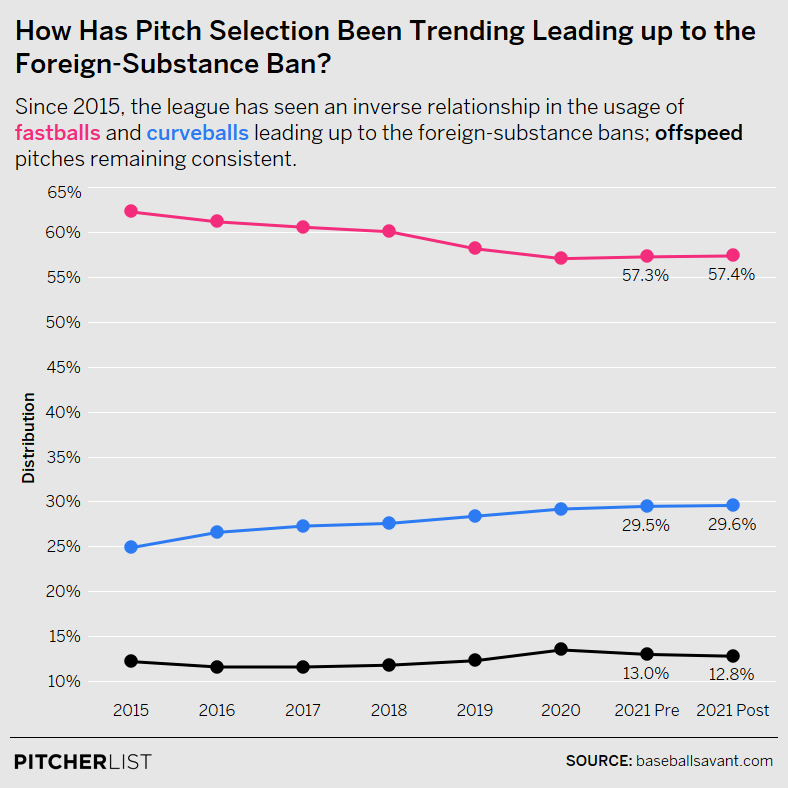
At a macro level, MLB has been on a steady upward march of fastball velocity, yet, despite faster fastballs than ever, pitchers have been throwing them as a decreasing percentage of their total pitches. In their place, pitchers have been throwing more and more breaking pitches with greater and greater movement at greater and greater velocities.
It stands to reason that the increasing percentage of breaking balls has been due in some measure to the improved grip that came from using sticky stuff. Cole didn’t explicitly say this in the quotes above, but it is generally accepted reality that it is really hard to spin well commanded, high velocity breaking pitches without a very strong grip.
With four-seam fastball spin and movement down and the ability to grip breaking pitches presumably challenged, we might have expected to see pitchers move to a greater proportion of offspeed pitches. Instead, they threw more fastballs than before the ban and continued the trend of offering more breaking balls than ever.
Those generic buckets of fastballs, breaking balls, and offspeed pitches are convenient for making high-level observations, but it’s worth looking more granularly to see if pitchers made any adjustments to the mix of pitch types within those buckets:
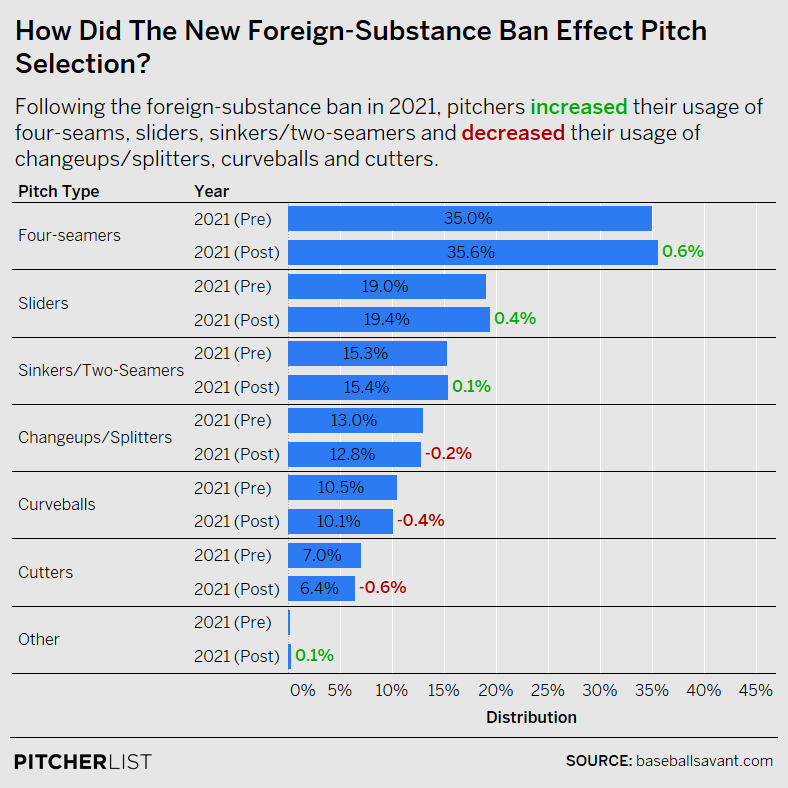
Last June, there were some early indications of a shift toward slower-spinning two-seamers, but this data shows that trend did not hold through the rest of the season. Instead, pitchers leaned on their four-seamers more heavily, even though those four-seamers were spinning and moving less on average. Curveballs, as might be expected, were deployed less often and seemingly replaced by sliders. Typically lower-spin changeups, splitters, and forkballs, which might have been expected to see an increase in usage from the sticky ban, declined slightly.
There is a fair bit of noise that comes with using league-level data for this comparison because the pitchers in the pre-ban and post-ban populations are different, thanks to injuries, rookie debuts, and other roster and playing time and role evolutions throughout the season. With the help of Jeff Nicholas of Pitcher List’s data team, and to add some additional rigor to this analysis, we re-ran these numbers with only the 317 pitchers who threw at least 250 pitches on each side of the ban. While that is an admittedly arbitrary threshold, it resulted in a population that contained a mix of starters and relievers who all had worked quite a bit.
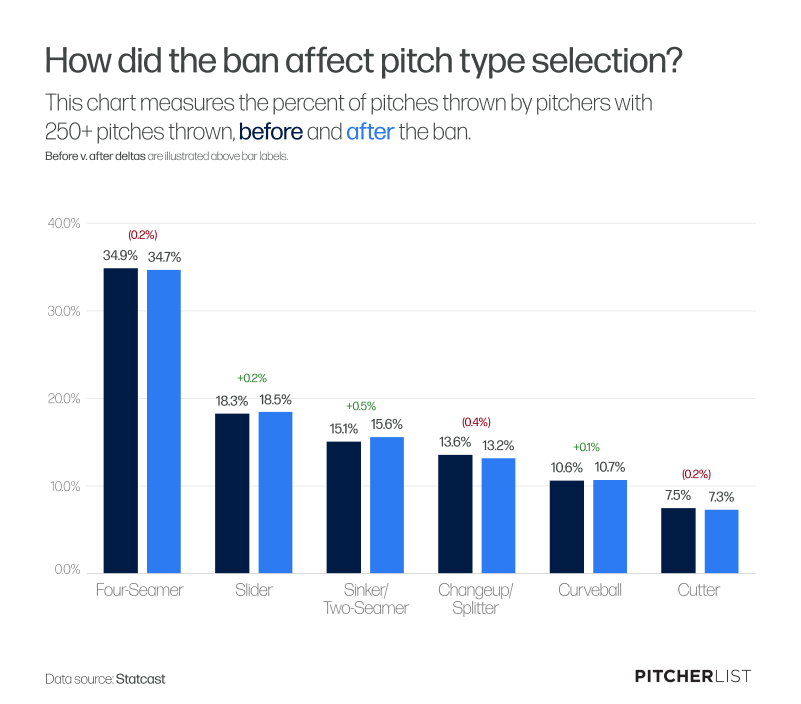
Within this population, the general arc of the changes after the ban is mostly consistent with what we found above. The overall rates of fastballs and breaking balls ticked up, while offspeed usage declined. More granularly, there were some subtle differences within this group, compared to the entire league. This group seems to have traded four-seamers for two-seamers and sinkers at a higher rate than the broader league. Slider usage ticked up slightly just as with the league, but seemingly not so much at the expense of curveballs, which held steady.
In both groups — the full league and the group that met our threshold for pitches thrown — the pitch mix changes are just a few tenths of a percentage point here and there. There are more than 700,000 pitches thrown over the course of a full MLB season. At that scale, a few tenths of a point change represents as many as a few thousand pitches. Spread over 2,430 regular-season games (or even just a bit more than half that to account for the ban occurring mid-season), all we’re talking about with these adjustments are a handful of pitches each game.
To my eyes, the major takeaway of all this data is that, despite how the immediate reaction to the policy enforcement made it seem, there was not a major, baseball-wide adjustment in how pitchers selected their pitches.
The Lost Spin Rate Group
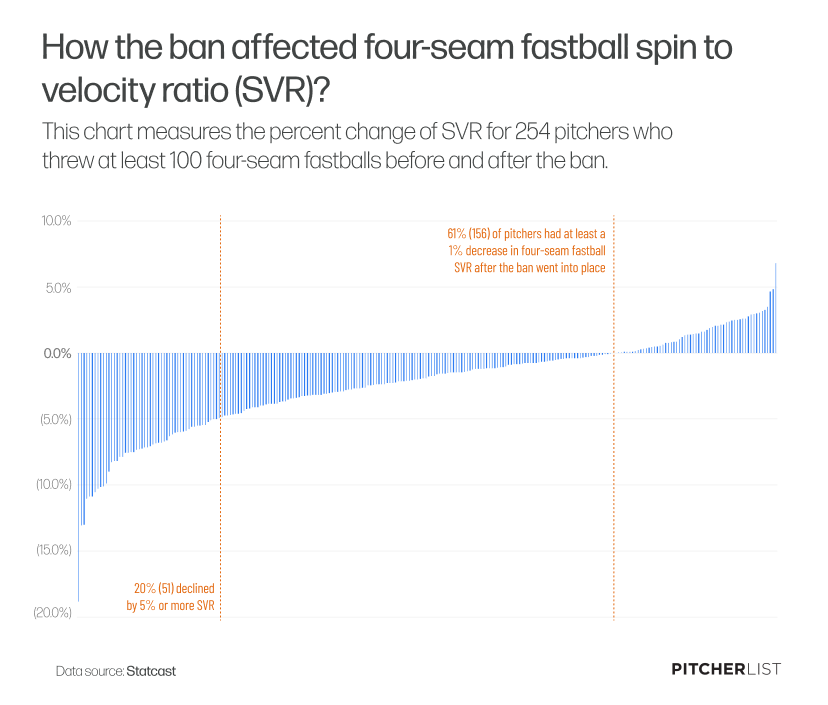
With that somewhat unexpected league-level finding in hand, I wondered if the aggregation was obscuring meaningful pitch mix changes in the population hardest hit by the sticky ban – those who lost the most spin.
A query of the Statcast databases yields 254 pitchers who threw at least 100 four-seam fastballs before June 3 and after June 21. Of those, about 61% (156) showed at least a 1% decrease in four-seam fastball spin to velocity ratio after the ban went into place. About 20% (51) declined by 5% or more.
Here, I focused on those 51 pitchers who lost 5% or more of their four-seam fastball spin to velocity ratio and again compared their pitch mixes before and after the ban.
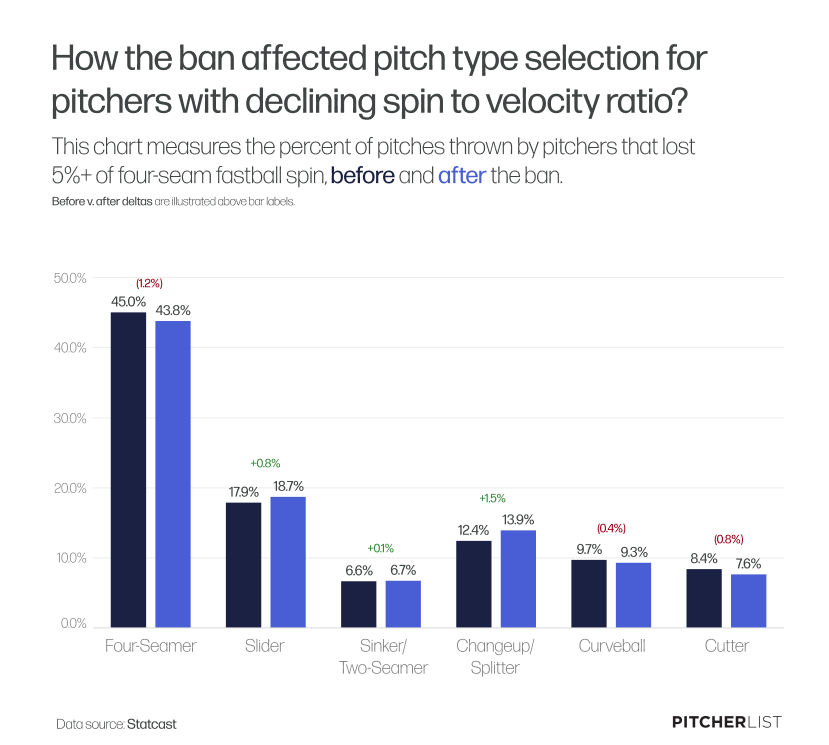
This data shows more noticeable changes that are perhaps more in line with what we might have assumed would happen. It’s worth pointing out that this group started out more dependent on fastballs (~60% usage of four-seamers, two-seamers, sinkers, and cutters) compared to the league data above (~57%). Within that, this group’s mix of fastball types was much more heavily skewed to the side of four-seamers than the rest of the league (~45% to ~35%).
After the sticky ban, and differently than the league overall, this group’s four-seam fastball, cutter, and curveball rates decreased significantly. Like the rest of the league, sliders seemed to be the preferred alternative to those pitch types, but this group deviated by turning to their changeups and splitters at a greater frequency.
Conclusions
So, that’s a lot of data and multiple little changes that we could read too far into. What should we make of all this? I posit that the cleanest takeaways are threefold.
First, the sticky stuff crackdown had the league’s desired effects, albeit in modest proportion. Spin rates went down, pitch movement went down, and offensive action went up. That’s what MLB wanted.
Second, the crackdown does not seem to have led to a widespread change in pitch mix strategy. At the league level, pitchers mostly operated in a similar manner before and after. They continued to lean heavily on their four-seam fastballs and threw a higher rate of breaking pitches than ever. In a macro sense, it was mostly business as usual, despite the slightly diminished stuff.
Those league-level takeaways don’t diminish the impact the ban had on specific individuals. It certainly was not business as usual for Garrett Richards. That’s the third takeaway from this data — the pitchers who lost the most RPM and spin to velocity ratio after the ban were the ones who adjusted their pitch mixes the most. That group was more likely to swap out four-seam fastballs, curveballs, and cutters for sliders and changeups than the rest of the league.
In the end, maybe these findings should have been expected. Making big changes to the way the game is played is tough to do through policy. Doing so during a season, when routines and habits are well-established is even tougher. We’ll find out if an offseason worth of time to tinker with pitches and grips leads to broader changes in 2022. But looking back now, despite the awkward mid-season implementation, the loud outcry from prominent pitchers, and bold predictions of how the game would be changed, the sticky stuff crackdown now looks to have been much ado about fairly little.
Thanks to Jeff Nicholas for data and research support. Featured image by Shawn Palmer (@Palmerguyboston on Twitter). Data Visualizations by @Kollauf and @Visual_Endgame on Twitter.
Nice job, this is a great read.