


The most important of the three new facets added to xRV 2.0 was my measurement of indistinguishability as measured by an estimation of pitch tunneling. Specifically, as I talked about in Expected Run Value (xRV) 2.0 – Adding Deception, I constructed a Break:Tunnel ratio for each pitch thrown in 2020, a structure inspired by the work of Pavlidis, Judge, and Long for Baseball Prospectus back in 2017. I described my interpretation of the ratio, which I call “TotalTunnel”:
“To effectively tunnel pitches, the goal is to minimize the distance of two pitches at the commit point (or tunnel point, point of no return, etc.) while then maximizing the distance between the pitch’s final coordinates. This simulates the “late break” that’s theoretically happening as the hitter is attempting to make contact. For the sake of my model, I simply took the Euclidean distances of the two pitches at their commit points and divided it by the pitches final Euclidean distances to create my tunnel metric. Thus, a smaller value was more favorable.”
In terms of its importance to xRV, pitch tunneling was the fourth-most-important pitch attribute overall, only behind spin direction, velocity, and vertical movement.
As I dug a little deeper into this specific aspect of the entire xRV model, there were a few questions I wanted to answer.
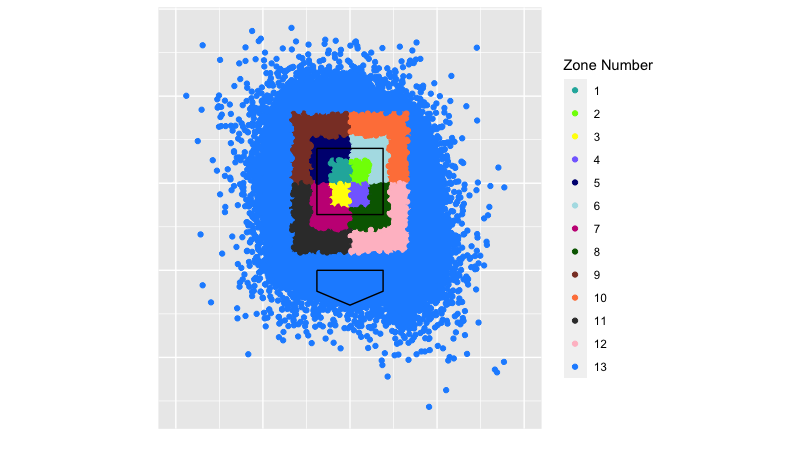
For each of the 12 zones, what is the best tunneled secondary pitch given where the pitcher located his primary pitch?
The plot below illustrates how I divided pitches into 12 zones of interest, plus an additional zone for “waste” pitches.
| Zone | Pitcher | Team | Sec. Pitch | Main Pitch | Main Pitch Zone | Pitches | Zone TotalTunnel |
|---|---|---|---|---|---|---|---|
| 1 | Jakob Junis | Royals | 4-Seam | Slider | 4 | 20 | 0.14203 |
| 2 | Rich Hill | Twins | Curveball | 4-Seam | 10 | 15 | 0.11892 |
| 3 | Nathan Eovaldi | Red Sox | Curveball | 4-Seam | 5 | 15 | 0.10888 |
| 4 | Adam Wainwright | Cardinals | Sinker | Curveball | 12 | 25 | 0.08593 |
| 5 | Brandon Workman | Red Sox/Phillies | 4-Seam | Knuckle Curve | 3 | 30 | 0.16725 |
| 6 | Patrick Corbin | Nationals | Sinker | Slider | 4 | 25 | 0.20232 |
| 7 | Max Fried | Braves | Slider | 4-Seam | 5 | 36 | 0.18998 |
| 8 | Clayton Kershaw | Dodgers | Curveball | 4-Seam | 6 | 19 | 0.15006 |
| 9 | Adam Wainwright | Cardinals | Sinker | Curveball | 3 | 19 | 0.22166 |
| 10 | James Karinchak | Indians | 4-Seam | Curveball | 8 | 12 | 0.28534 |
| 11 | Blake Snell | Rays | Curveball | 4-Seam | 3 | 28 | 0.16627 |
| 12 | Trevor Bauer | Reds | Knuckle Curve | 4-Seam | 6 | 33 | 0.17731 |
One can interpret this table as such: Jakob Junis’ four-seam fastball thrown in zone 1 was best tunneled with his slider thrown in zone 4, and this was the best TotalTunnel ratio of any pitch type combination in zone 1 (min. 15 pitches).
Adam Wainwright’s name appears twice on this leaderboard, as he’s able to tunnel his curveball/sinker combination in multiple locations better than anyone. He also possesses the best 2-pitch combination in any location with his sinker thrown in zone 4 (heart low glove-side) and his curveball thrown in zone 12 (chase low glove-side). That combination is shown here:
https://gfycat.com/skeletalenviousguppy
Special thanks to Alex Fast for his pitch overlay tutorial as a part of Pitcher List’s PitchCon 2021!
That certainly doesn’t look like what you’d expect from the best tunnel combination in baseball. However, remember that my TotalTunnel metric is based on the Break:Tunnel ratio, so while Wainwright doesn’t have the sheer decision point overlay (as evidenced by this GIF) that other pitch combinations have, it’s still considerable relative to the massive difference in his final pitch locations. The same rationale applies to Rich Hill’s curveball/4-seam tunnel, the third-best combination.
What’s interesting about Wainwright is that when looking at his curveball/sinker tunnel in general (based on where he throws each pitch on average), it’s actually one of the worst TotalTunnels. Let me explain.
The pitches work phenomenally well together only when they’re optimally located. Wainwright too often puts his curveball and sinker in zone 4 which doesn’t let the tunnel effect work. This isn’t to say that his overall pitch strategy is sub-optimal because I’m not claiming pitch tunneling to be the sole predictor of pitch quality. He drops in the Uncle Charlie quite often to start at-bats against most hitters who are naturally uncomfortable attacking curveballs in an 0-0 count, and that’s fine. What I am claiming here is that he could take advantage of his curveball/sinker relationship more if he threw his curveball lower as he did in the above GIF. As it turns out, that nasty curveball thrown to Casali was to start the AB.
This leaderboard’s fifth best TotalTunnel is Clayton Kershaw’s fastball thrown high and arm-side with his curveball thrown low and arm-side. Here we see a more typical representation of what we think of as pitch tunneling. They look extremely similar for a long amount of time before respectively ending up at the top and bottom of the strike zone.
https://gfycat.com/adorablebaggybovine
What are the best tunneled secondary pitch types in general given the typical locations of the pitcher’s primary pitch?
I previously described how I weighted each pitch’s relationship with the main pitch type in the xRV 2.0 piece:
“The kicker is that I also took all the “main pitches” (roughly 80% of these are fastballs) and divided them up into 13 zones as defined by MLB’s heart, shadow, chase and waste zones to get more precise with the relationships. From there, I calculated how well each secondary pitch would tunnel with the pitcher’s main pitch when thrown in each of the 13 zones. Finally, I took a weighted average of those estimated tunnels based on where the pitcher located his main pitch in 2020 to construct my tunnel metric.”
Because of this, TotalTunnel in the following leaderboard is not only measuring how well two pitch types are working together, but it also captures how efficient each pitcher is at optimally locating their primary pitch type given the shape and movement profile of each secondary pitch.
Unlike the last leaderboard, this one isn’t picking out specific zones for both the primary and secondary pitch types. Rather, it’s simply how well the secondary pitch tunnels with the primary given where the pitcher threw the primary in totality. This is where Wainwright’s overall pitch tunneling is downplayed.
| Rank | Pitcher | Team | Sec. Pitch | Zone | Main Pitch |
|---|---|---|---|---|---|
| 1 | Shane Bieber | Indians | Knuckle Curve | 12 | 4-Seam |
| 2 | Trevor Williams | Pirates | Slider | 12 | 4-Seam |
| 3 | Andrew Heaney | Angels | Curveball | 11 | 4-Seam |
| 4 | Derek Holland | Pirates | Knuckle Curve | 11 | Sinker |
| 5 | Jack Flaherty | Cardinals | Slider | 12 | 4-Seam |
| 6 | Tyler Mahle | Reds | Slider | 12 | 4-Seam |
| 7 | Ryan Yarbrough | Rays | Changeup | 12 | Cutter |
| 8 | Framber Valdez | Astros | Curveball | 11 | Sinker |
| 9 | Michael Pineda | Twins | Slider | 12 | 4-Seam |
| 10 | Carlos Carrasco | Indians | Slider | 12 | 4-Seam |
| 11 | Trevor Williams | Pirates | Slider | 8 | 4-Seam |
| 12 | Gerrit Cole | Yankees | Slider | 12 | 4-Seam |
| 13 | Shane Bieber | Indians | Slider | 12 | 4-Seam |
| 14 | Lance McCullers Jr. | Astros | Knuckle Curve | 12 | Sinker |
| 15 | Justus Sheffield | Mariners | Slider | 11 | Sinker |
“Chase” zone breaking balls dominate this leaderboard, as consistent command in these zones allows pitchers to take advantage of their tunnel effect. Maximizing the final pitch location without compromising the tunnel at the commit point (the essence of the Break:Tunnel ratio) is almost always best accomplished with breaking balls. In a different method where pitch tunneling is only measured by commit point similarity, breaking balls wouldn’t perform as well. However, the theory of the tunnel effect is only effective for pitchers should the pitches eventually diverge in some fashion. Otherwise, the job of the hitter is simplified sans a huge velocity difference.
There are plenty of household names here, including Shane Bieber having both his knuckle curve and slider in the top-15.
https://gfycat.com/saltyplayfulhyrax
Also, Trevor Williams? His slider was the best tunneled pitch in two different zones, both glove-side low in the shadow and waste zones. The pitch has roughly average movement, but Williams was still able to generate a 40% whiff rate which was in the top third among pitchers who threw at least 50 of them in 2020.
https://gfycat.com/tiredignorantantipodesgreenparakeet
Looking at pitch types in general, what are the best tunneled combinations?
| Rank | Secondary Pitch Type | Secondary Zone | Pitches | Main Pitch Type | Main Pitch Best Tunneled Zone |
|---|---|---|---|---|---|
| 1 | Curveball | 12 | 579 | Sinker | 3 |
| 2 | Curveball | 12 | 1,502 | 4-Seam | 6 |
| 3 | Slider | 12 | 1,468 | Sinker | 7 |
| 4 | Cutter | 12 | 734 | 4-Seam | 4 |
| 5 | Slider | 12 | 3,480 | 4-Seam | 1 |
| 6 | Cutter | 8 | 960 | 4-Seam | 1 |
| 7 | 4-Seam | 6 | 573 | Sinker | 7 |
| 8 | Changeup | 12 | 1,029 | 4-Seam | 8 |
| 9 | Changeup | 7 | 2,526 | 4-Seam | 5 |
| 10 | 4-Seam | 5 | 665 | Slider | 8 |
One can interpret this table as such: A curveball thrown in zone 12 and a sinker thrown in zone 3 was the best tunneled combination for right-handed pitchers in 2020.
| Rank | Secondary Pitch Type | Secondary Zone | Pitches | Main Pitch Type | Main Pitch Best Tunneled Zone |
|---|---|---|---|---|---|
| 1 | Curveball | 11 | 711 | 4-Seam | 1 |
| 2 | Slider | 11 | 1,003 | 4-Seam | 1 |
| 3 | Changeup | 11 | 364 | 4-Seam | 7 |
| 4 | Changeup | 12 | 763 | 4-Seam | 6 |
| 5 | Changeup | 7 | 440 | 4-Seam | 1 |
| 6 | Changeup | 8 | 1,120 | 4-Seam | 6 |
| 7 | Slider | 11 | 359 | Sinker | 7 |
| 8 | Slider | 7 | 1,032 | 4-Seam | 1 |
| 9 | Changeup | 10 | 306 | 4-Seam | 5 |
| 10 | Curveball | 7 | 680 | 4-Seam | 1 |
When grouping by zone, we see that breaking balls in zone 12 for RHPs and zone 11 for LHPs dominate in terms of tunneling when paired with fastballs in the zone. This backs up what we saw from the previous leaderboards. Lefties that require more constant usage of changeups push the pitch type up into their leaderboard more often. Their low changeups, both in the shadow and waste zones, are the best tunneled pitches other than the glove-side breaking balls that RHPs also reap the benefits of.
To save you some scrolling, here’s the zone plot again:
In the end, pitch tunneling is still largely an open book in terms of its exact effects on pitch quality. My goal with TotalTunnel as a predictor of Expected Run Value was to model how pitches play off of each other through visual deception. Not only was the analysis of whiff rates or xwOBAs not telling the story about a pitch type, but even xRV 1.0 wasn’t accounting for how one pitch could affect the result of future pitches. Further adjustments could prove to be fruitful, such as Long, Pavlidis, and Alonso (in their own modeling of pitch tunneling) adjusting for hitter point of view rather than looking at pitches from the catcher’s standpoint. They also made their tunnel point time-based due to the fact that a fastball will reach the commit point faster than a breaking ball, and this is something I can look into for future versions of TotalTunnel and xRV.
Photo by Erik Drost | Design by Quincey Dong (@threerundong on Twitter)
Hey Luke, nice work. It’s very intuitive, but did you find the tunneling metric to be more predictive of results (CSW, SIERA, etc.) than the distance at commit or the final distance individually?
Hey Noah, thanks for the question!
The key with the tunnel metric is that neither distance at the commit point or the final distance is particularly beneficial without the other — they work together, and this relationship as defined by the ratio is what’s important. That said, I haven’t looked at the results from the distances individually. My guess would be that final distance differential would be more important than the distance at the commit point alone. If two pitches are indistinguishable at the commit point and remain indistinguishable as they cross the plate, the job of the hitter just got a whole lot easier. The same could still be said about the final distance differential if the two pitches are clearly distinguishable early in the pitch trajectories, no matter the final distance.
My confidence in the ratio is largely from the fact that it’s calculated importance to the entire xRV model was greater than both vertical and horizontal location, raw spin rate, and horizontal movement.
While I think this model serves to be more descriptive than predictive, testing the predictiveness of some of the result you mentioned is likely something I’ll look to once we get another full year’s worth of data.