


(Photo by William Purnell/Icon Sportswire)
Is it better to burn out than to fade away? It’s a tough question many Major League Baseball pitchers face and there is never an easy answer. Do you continue to pitch when it becomes evident you’re a shell of your former self, jeopardizing your team’s season with spotty starts? Can you accept a limited role in long relief or as an emergency starter? Egos get in the way, especially if you were a once-prominent fixture in the starting rotation. Even management is faced with tough choices when dealing with a player who has given your team so much while also being owed a decent chunk of team salary.
Saint Louis Cardinals starter and three-time All-Star, reining (pitcher) Silver Slugger, and 2006 World Series Champion Adam Wainwright is struggling in 2018. He made three starts early this season before heading to the disabled list with elbow inflammation; an injury that may or may not have shown up during that start. It was clear something was off after his best pitch this season, the cutter (3.81 wCT/C), was way off during his April 17th start at Wrigley Field. Out of the 25 cutters he threw in that start, none were in the zone (nine hit the shadow).
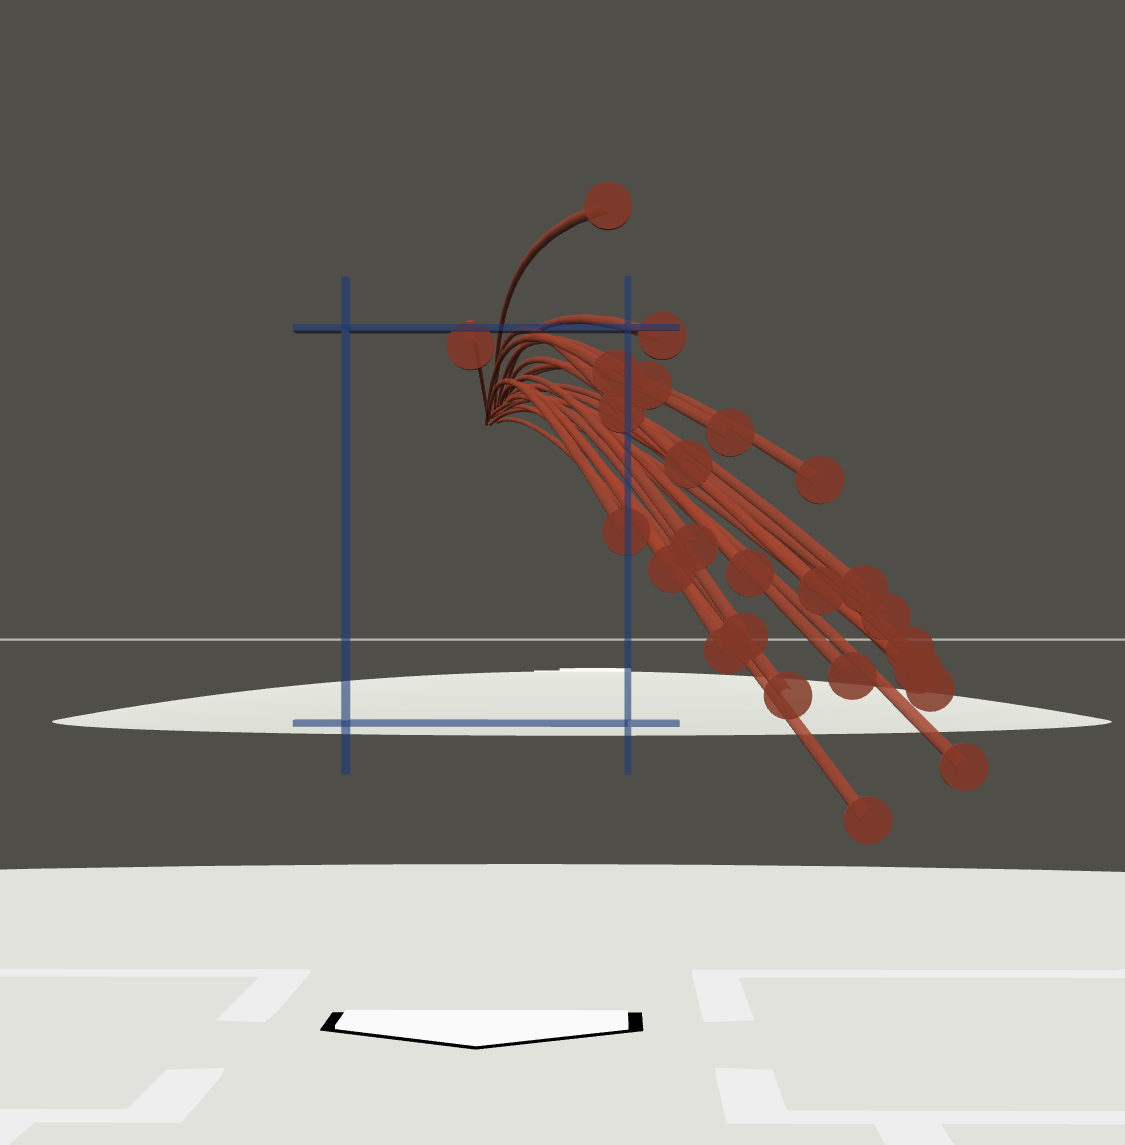
CHART 1, VS four lefties and five righties
Fast-forward a month later and we have Wainwright’s latest underwhelming start; 2.1 IP, 3-1 BB/K rate, and nine of his 15 batters faced reaching base. It was also one of the shortest outings of Wainwright’s career. The sketchy part is that he faced a less than formidable San Diego Padres lineup. There are varied reasons for the bad start, one of which is that lingering elbow issue he doesn’t seem to be completely over, and may result in another DL stint.
Despite his troubles, Wainwright’s ERA is just 4.00, his FB% is in line with his career mark, his HR/FB rate is elevated from his average but in line with where it’s been the last three seasons. His .309 BABIP gives no indication he’s either been lucky or unlucky. His xStats differentials, when looking at batting average and slugging percentage, shows no major imbalances either (the actual only slightly elevated from the expected). His strikeout rate, though a bit lower than normal, is still at the same level it was in 2017 and not that far off from his 2016 season. No real concerns with loss of velocity in 2018, either; most everything is right where you’d expect it to be when looking back at Wainwright’s last several seasons. And while his velocity was down at Petco yesterday, the rest could be considered decent news.
One other thing to mention is his overall plate discipline; completely indicative of his lack of control. At the forefront is his Swing%, which is down about 13% from his recent average and his Zone% that sits at 35.5%; well below normal. Chart 2 shows Wainwright’s degenerating plate discipline rates.
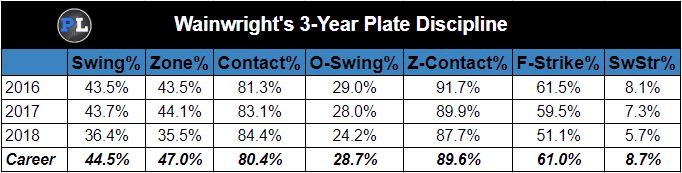
CHART 2
The only factor that doesn’t make sense is his decreasing zone contact rate; usually, a good thing and can typically coincide with an increased whiff rate yet clearly isn’t the case.
Physical ailments aside, here’s Wainwright’s trouble; he’s walking batters. A lot. His BB% is 2.5 times higher than his career average of 6.4%. He’s had one start this season where he didn’t walk a single hitter; the rest has him giving free passes of four (twice) and six (last start). And it gets worse. His BB/K rate is nearly even; for every strikeout, he’s also allowing a walk. Chart 3 shows his K% and BB% trends through his career; special attention paid to the last three seasons. Since 2013, his differential has slowly closed with the gap thinning following his 2015 TJ surgery. The walk rate is troubling, regardless of the fact its just four starts, and is demonstrating a continuing trend.
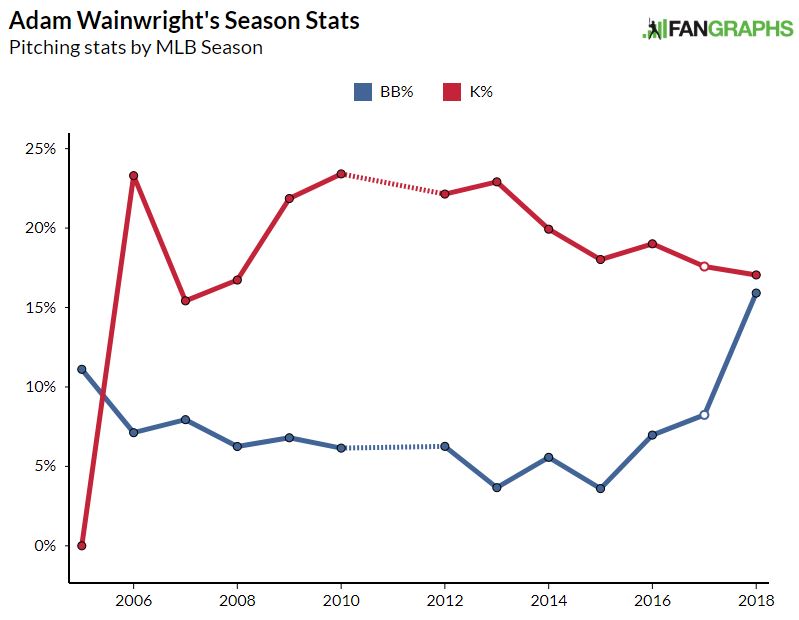
CHART 3
OK, so what has he been throwing? Let’s inspect his pitch selection. Wainwright relies on his fastball(s) much less than most pitchers in MLB, though it’s still his most-used pitch. Chart 4 demonstrates his pitch usage by year. Take note that the cutter is actually a fastball but we are going to separate it from the others since it was more prominent (or once was, rather).
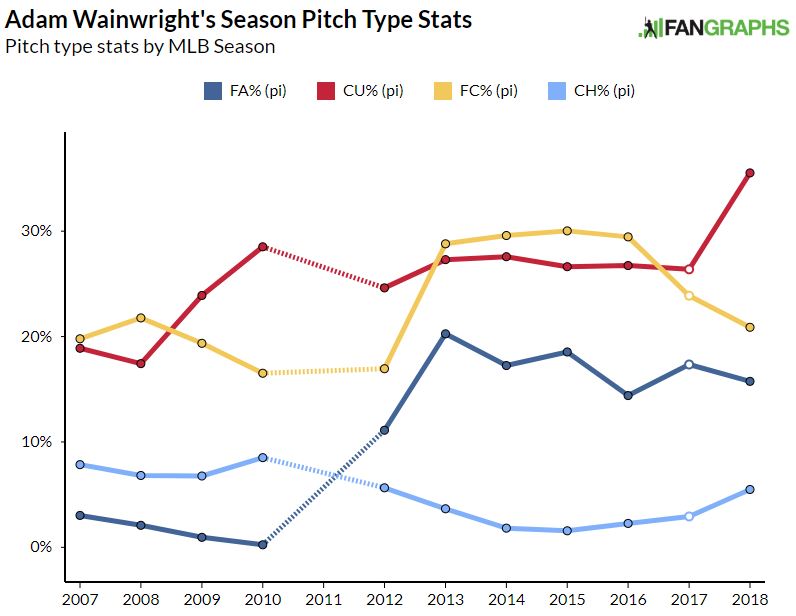
CHART 4
In 2018, Wainwright’s fastballs (cutter included here) have been used slightly more (~4%) than his bread-and-butter curveball. After using the fastball more in 2017 than he had in 2009, he’s cut back on it heavily; the .386 BAA makes strong reasoning for that. In its place, Wainwright’s curveball usage has gone through the roof in 2018. While it’s yielding a .167 batting average, it’s not nearly as accurate as it used to be (almost 50% of his curves are landing out of the zone). That’s not necessarily bad as most secondary pitches are used to get swings in bad locations, but the fact that Wainwright is using it as much is creating a predicament.
Let’s key in on the curveball. Wainwright’s curve has always served him well; it generates a lot of whiffs (or rather it did), he’s been good at keeping it in or near the zone, and home runs off the pitch are minimal. There’s a conspicuous difference in 2018; the pitch is producing extra horizontal movement. Numerically, Wainwright’s curve has averaged about 9.5 inches of horizontal movement from the release point. This year, its nearly 12 inches. The graphic below, Chart 5, shows the difference, which to the naked eye appears to be somewhat negligible.
CHART 5
Getting back to release point for a moment, that is off too albeit not terribly. Wainwright’s 2016/17 horizontal and vertical release point (in terms of feet) is -1.24H/6.34V. In 2018 the metrics are showing a -1.63H/6.05V. What appears to be small aberration can actually have a big effect on location and accuracy. As mentioned, its producing balls nearly half of the time its thrown compared to his previous two seasons where it was nearly 37%.
The curve that was once a trademark for Wainwright is now becoming a burden. Chances are his lingering elbow issues are to blame. Should he return, can he keep throwing that once-elite pitch? If he cannot, that won’t bode well for his future given the lack of effectiveness of the rest of his repertoire.
Regardless, you can’t get away with walking almost 16% of the batters you face. While his ERA remains respectable, he’s benefitting from a strong Cardinals defense. Wainwright is putting runners on, mainly by walks, but currently holds a career-high 80.8% LOB-rate. Wainwright can still be a serviceable pitcher but he has to prove to Cardinal Nation he can last more than five innings on a regular basis. The way he’s pitching now, it would be hard to see him in any role outside of either long relief or mop-up duty so long as the elbow doesn’t end up making Wainwright’s career decisions for him.
This tells me check back next year if the elbow is healthy. Thx.
Hopefully there IS a next year.