


(Photo by Jeff Chevrier/Icon Sportswire)
It’s easy to look at 2017 Didi Gregorius and get excited, particularly as a Yankee fan. Didi missed the first 3.5 weeks of the regular season before bursting on the scene in a way very few predicted. He carried a .300+ average into late August and hit homers at a higher rate than he’d ever hit before. But what happened to create this unbelievable change in Didi’s production?
First, let’s take a look at Didi’s progression in his 3 years with the Yankees:
| PAs | BABIP | AVG | OBP | SLG | HR | BB% | K% | |
| 2012-14 | 724 | .280 | .243 | .313 | .366 | 13 | 8.1 | 16.9 |
| 2015 | 578 | .297 | .265 | .318 | .370 | 9 | 5.7 | 14.7 |
| 2016 | 598 | .290 | .276 | .304 | .447 | 20 | 3.2 | 13.7 |
| 2017 | 570 | .287 | .287 | .318 | .478 | 25 | 4.4 | 12.3 |
I omitted R and RBI as they are largely team dependent and the Yankees have improved a lot since 2015, so I don’t want those stats telling the story. There are a few immediate takeaways- a consistently improving average, a consistently improving SLG%, an improving K%, and a huge jump in homers. As with my previous Going Deep posts, I’d like to now delve into the change, how this change happened, and the sustainability of it. At this point, I’m between two conclusions: either Didi is destined for massive regression or he has some ability that we are currently unable to quantify.
Why is there concern about Didi? As a Yankee fan, I’ve fallen in love with Didi over the last two seasons, but there are reasons for immediate concern:
| xStats | xBABIP | xAVG | xSLG | xHR | VH% | PH% | OUTs | Avg EV |
| 2015 | .288 | .255 | .338 | 6.9 | 2.4 | 27.0 | .184 | 85.1 |
| 2016 | .272 | .250 | .364 | 11.9 | 4.2 | 31.1 | .220 | 85.4 |
| 2017 | .268 | .257 | .401 | 15.2 | 5.1 | 32.3 | .161 | 84.4 |
Looking at the xStats table first- when comparing that against his actual statistics, you’ll see a massive disparity in batting average, slugging percentage, and home runs. But not just in 2017, but in ’16 and ’15 as well. Didi’s disparity is not just large, but it’s unique in how large it is. See the table below (Min. 400 PAs for ranks)
| D. Gregorius | AVG-xAVG | Rank | SLG-xSLG | Rank |
| 2016 xStats | .027 | 4th | .083 | 1st |
| 2016 Baseball Savant | .039 | 18th | .103 | 2nd |
| 2017 xStats | .030 | 12th | .076 | 2nd |
| 2017 Baseball Savant | .040 | 21st | .114 | 2nd |
By both xStats and Baseball Savant, Didi ranks in the Top 2 in the last two years in the disparity between actual slugging percentage and expected slugging percentage based on batted ball data, and the top 21 in the same disparity for batting average. Ok, so we’ve got two big questions to answer: 1) How does Didi sustain his batting average? and 2) How does Didi maintain his power numbers? Let’s start with the first one.
The initial presumption when we see a vast disparity like this is that a hitter is getting lucky. Didi’s apparent luck in batting average becomes a little clearer when looking at the graph below.
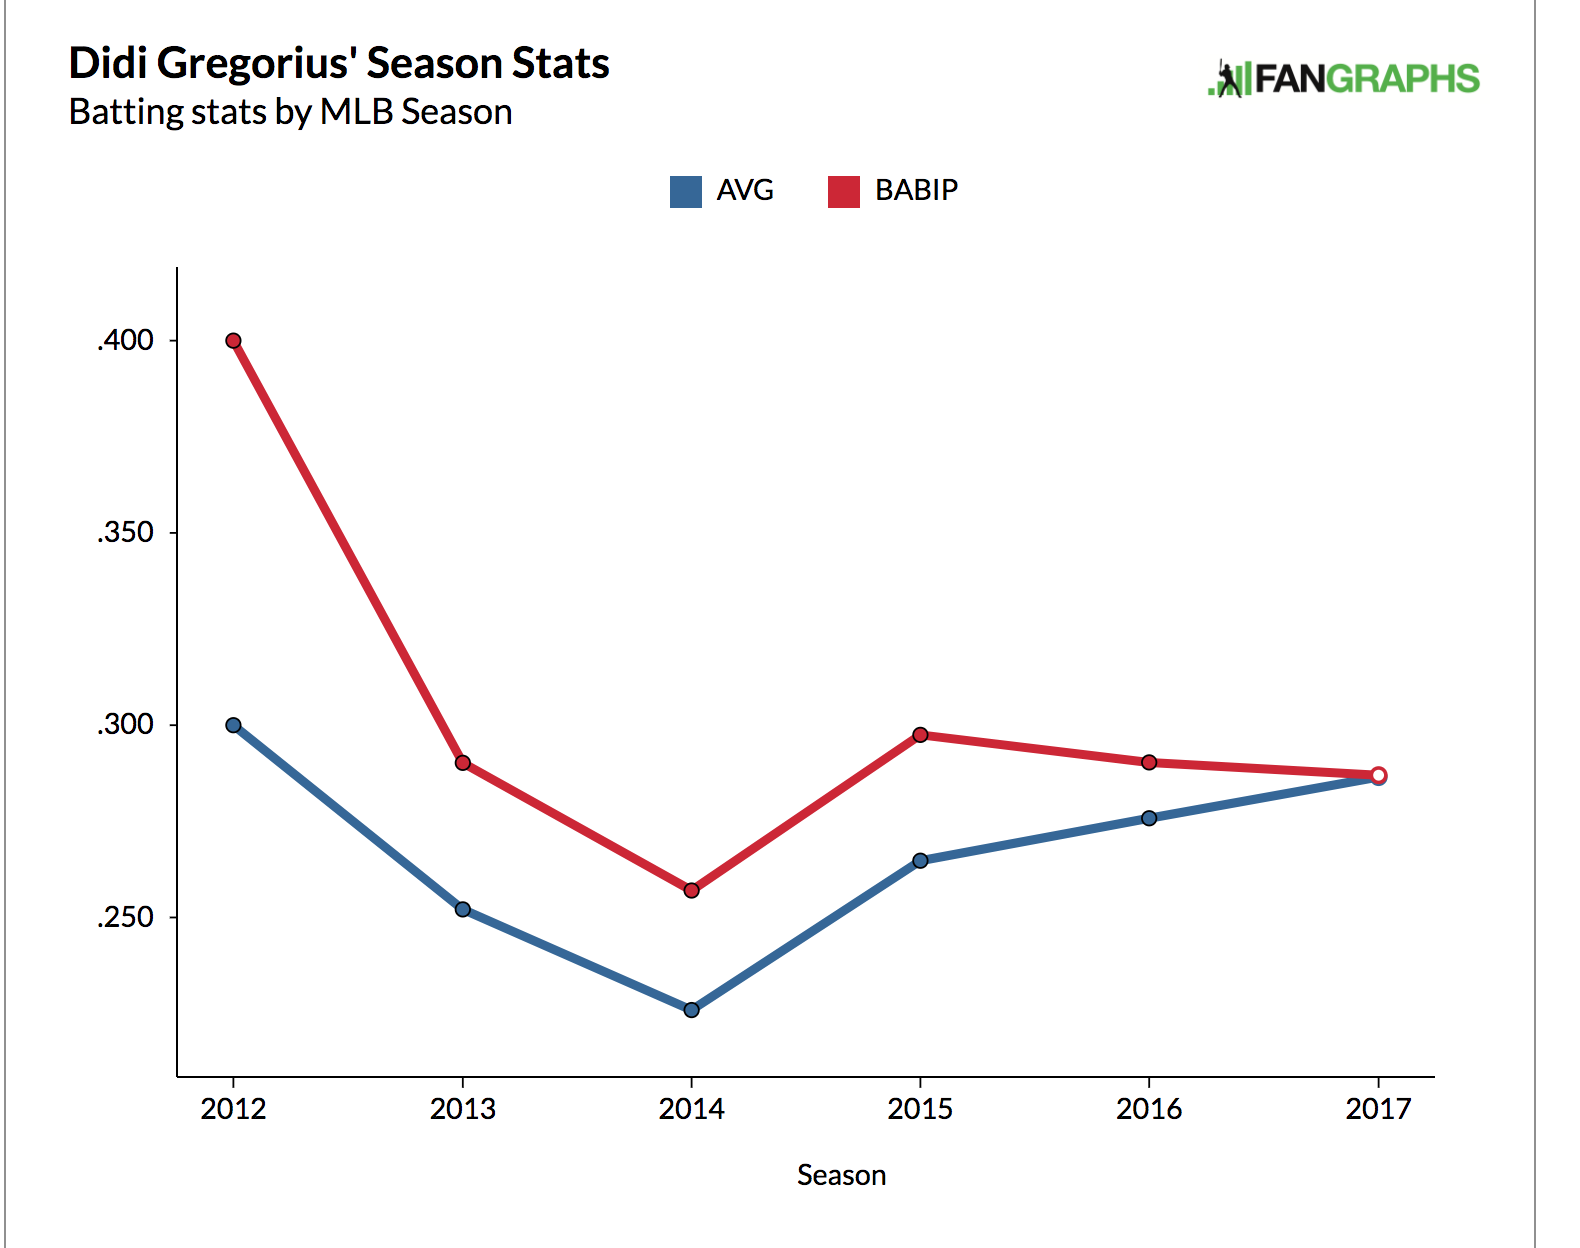
This graph isn’t meant to say he’s getting lucky or unlucky with his BABIP. By the way, if you’re curious to learn more about BABIP for hitters, check out this great breakdown. The concern with this graph is that while Didi’s BABIP has dropped over the last two seasons, his batting average has actually gone up, to the point where his BABIP and batting average were actually identical in 2017. Hitters usually can’t sustain a batting average equal to their BABIP for long; Didi was one of 3 hitters whose BABIP was equal to or lower than batting average in 2017 (Mike Moustakas and Anthony Rizzo). Hitters almost always have a comfortable gap between BABIP and AVG, which makes sense as the former is batting average but only on balls in play. You can see that gap in the first 4 years of Didi’s career; when one stat fell, the other fell with it. Therefore, assuming a similar batted ball profile and a similar BABIP in 2018, Didi’s average should fall. How far? About 30 points, which is in line with his 2017 xAVG as well as his rough career BABIP-batting average number. This is what typical logic tells us. However, Didi Gregorius defies typical logic.
Had I written this post a year ago, I’d have said Didi’s average has to fall because of his .014 gap in BABIP and batting average, along the exact same lines as this year’s argument. So we’re forced to question whether Didi can sustain an AVG in line with his BABIP. For that to happen, what we’re really looking for is a change in batting profile that corresponds to a lower BABIP. Basically, we’d be assuming the average change is real and the BABIP just hasn’t caught up yet. Therefore, we should see some combination of fewer pop-ups, fly balls, and line drives, and fewer pulled balls.
| PU% | FB% | LD% | Pull% | |
| 2015 | 9.3 | 34.1 | 21.2 | 38.5 |
| 2016 | 10.9 | 40.3 | 19.6 | 37.6 |
| 2017 | 15.5 | 43.8 | 20.0 | 40.3 |
The increased pop-up and fly ball rates lend themselves to a lower BABIP actually and this makes sense when we see his xBABIP fell from .288 in 2015 to .268 this past year. So we’ve addressed the BABIP issue. That still leaves us with the question of the increased average and gap between average and xAVG.
How did Didi increase his average? Well for one, he changed his swing during the 2015 season. That article is a bit confusing though because the Yankees state they’re fixing Didi’s swing to produce fewer pop-ups…then he started hitting more pop-ups. Take a look at the two gifs below- the first from September 2015, the second from August 2017.
[gfycat data_id=”AstonishingDefenselessKronosaurus”]
[gfycat data_id=”LivelyScientificGordonsetter”]
There are a number of major differences in these two swings despite both gifs featuring a fastball on the inner half. Take note of Didi’s posture when the pitchers begin their windups. In 2015 and after the Yankees changed Didi’s swing, you’ll notice Didi is standing almost upright before getting loaded. For one, he looks tense compared to 2017. Standing up like that also makes it more difficult to get drive on the ball because you can’t draw as much power from your legs. This is clear when looking at how he goes to get the pitch. In 2015, Didi’s upper body comes down on his swing, whereas, in 2017, it looks like Didi’s whole body comes together to get to it. This type of swing will generate more power over time by getting the legs more involved. Also, look at Didi’s feet. He goes from slightly closed in 2015 to slightly open in 2017- likely in order to get around on the inside fastball and pull more pitches for home runs. Standing open and falling away when he swings results in what we see in the graph above: high pull rate, more pop-ups, and more fly balls. We’ll come back to this aspect of his swing later.

Looking at these graphs side by side, we see Didi made a conscious effort in 2017 to pull fly balls. BUT this was not the case in 2016 when the change first occurred. Another layer of mystery.
This swing change leads more to an increase in power than average though for the reasons stated above. Therefore, we haven’t yet answered our average question. So let’s look to some of the deeper numbers to see if this average is supported. When a player improves in batting average, the first place I look is the contact and plate discipline numbers.
| Z-Swing% | Swing% | Z-Contact% | Contact% | Hard Hit% | SwStr% | K% | P/PA | I/Str | |
| 2015 | 71.1 | 51.5 | 88.7 | 79.5 | 22.5 | 10.6 | 14.7 | 3.62 | 32.4 |
| 2016 | 74.8 | 55.4 | 90.2 | 82.9 | 24.5 | 9.4 | 13.7 | 3.46 | 34.5 |
| 2017 | 81.3 | 58.2 | 88.5 | 80.4 | 23.1 | 11.4 | 12.3 | 3.63 | 33.9 |
While Didi has become a freer swinger over the last 3 seasons, he’s somehow reduced his strikeout rate. He’s not making more contact nor hitting it much harder. He’s also whiffing more, but it hasn’t translated to more strikeouts. And that’s a bit surprising because that swing rate is… high. 3rd highest in baseball in fact. So maybe he’s not hitting better, he’s just jumping on pitches early in the count and taking advantage. And the stats back that up, as he finished 17th in pitchers per plate appearance and 10th in percentage of strikes put in play in 2017. The common assumption at that point is that he is particularly adept at hitting fastballs, as they’re more likely to occur early in at-bats.
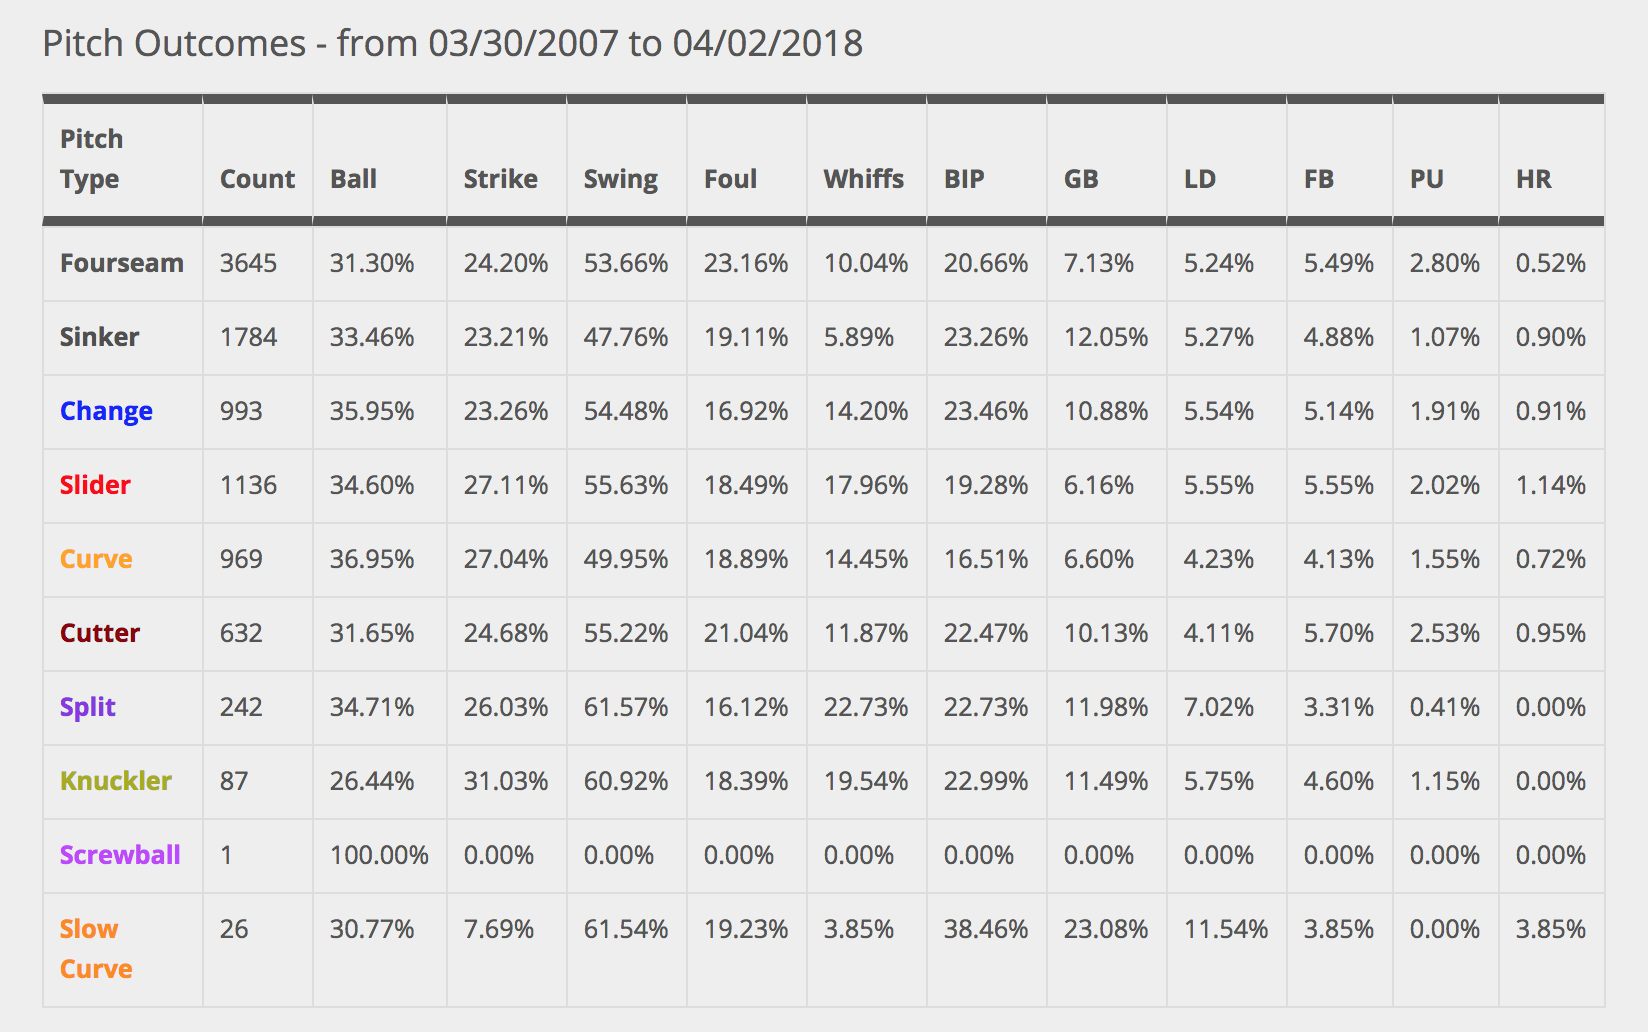
Surprisingly, Didi was in just the 26th percentile in 2017 batting average vs fastballs though (.261) vs the 98th percentile vs off-speed pitches (.327). This makes sense when looking at the table and seeing the high pop up rate and low HR rate on fastballs. So he swings early and often in counts, but he struggles relatively against fastballs, which is a bit counter-intuitive. Virtually every hitter with fewer pitches per plate appearance than Didi in 2017 had a higher batting average vs fastballs than Didi. Again, Didi Gregorius doesn’t make sense.
Regardless of the statistics, Didi still has a 30 point gap between batting average and xAVG, which tells us that when the average player hits a ball with the same launch angle and velocity that Didi does, his average is 30 points less than what Didi puts out. This could be sustained if Didi faced a large number of non-normal defense because xStats assume league average defense. Fangraphs doesn’t agree, however, as Didi had the 39th most plate appearances against no shift. I want to qualify that stat by saying I have no idea what they use to determine shift vs no-shift, so I’m not entirely sure how much I trust it. With no obvious rationale for an increase in average, I am forced to assume that his batting average is a fluke and destined to fall back to his statcast figures, roughly .260.
Now to the question that’s been plaguing me from the beginning- where does the power come from? Recall from earlier that Didi exceeded his xSLG by 77 points in 2017 and his xHR by almost 10. So, like above, we’re going to look at where the power came from and whether or not it is likely to stick.
As we saw in the gifs earlier, Didi switched to a more open stance to get around on inside pitches and use what power to has to pull them out of the park. In case you doubt that at all, here’s his 2017 HR spray chart:
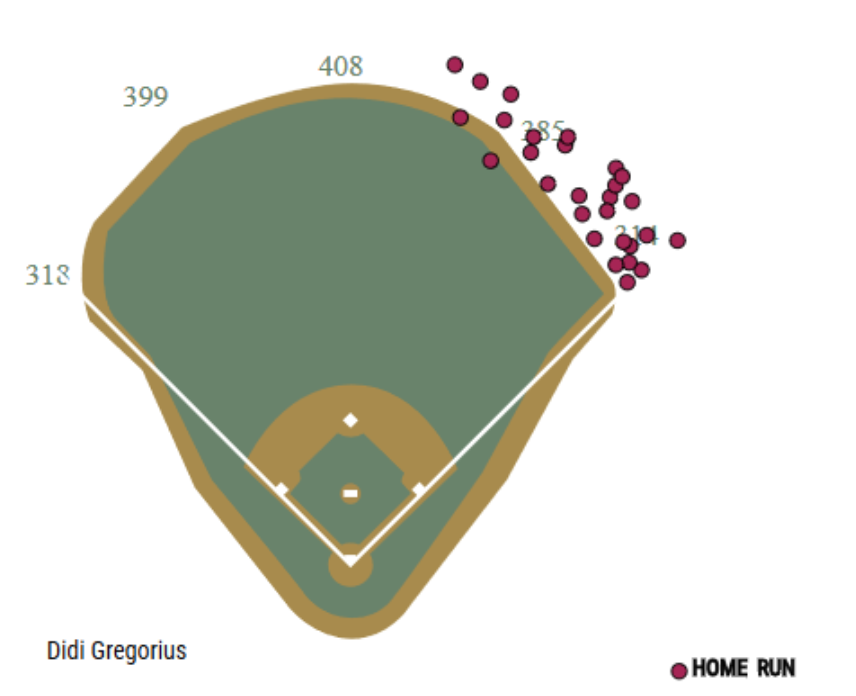
Not a single oppo taco or even one to dead center. That’s a guy whose swing is designed for pulling the ball down the line. The other thing you’ll notice is that none of those are very far. Check out the table below (of 242 players with at least 10 HRs) for Didi’s rates and ranks on his 2017 home runs.
| Avg. HR Exit Velocity | Avg. HR distance | xSLG | xBA | Avg. Pitch Vel. |
| 98.9 | 377 ft | 1.913 | .543 | 85.8 |
| 239th | 242nd | 239th | 239th | 233rd |
Didi had the 4th lowest average exit velocity on homers in 2017 and the shortest average distance. To go along with that, he carried the 4th lowest xSLG and 4th lowest xBA on his homers. Those are all frightening numbers, but not surprising at all. If most of Didi’s home runs were hit softly (relative to the league) with a short distance, it makes sense that most were not expected to leave the yard. Hitters with such a low HR distance do not tend to repeat their power; since statcast became available in 2015, only one hitter who averaged less than 390 ft per HR on at least 25 HRs matched or increased that total the next season (Evan Gattis 2015-16). Six of the eight lost more than five home runs in the next season. Furthermore, Didi is the only player to hit at least 25 homers with an average exit velocity below 100 since in the last 3 years. The statcast data does not bode well for Didi repeating his production at all.
But for Didi to defy the odds multiple seasons in a row, he must be doing something right. My first instinct is he’s simply taking advantage of Yankee Stadium. Let’s take a look at his 2017 splits to see if that’s right.
| AVG | SLG | OPS | HR | wOBA | |
| Home | .251 | .426 | .707 | 12 | .298 |
| Road | .321 | .528 | .882 | 13 | .371 |
So a left-handed hitter who is actively trying to pull the ball and get fly balls is somehow worse at the stadium that is perfectly designed for that. Interestingly enough, Didi actually got worse in 2017 at producing home runs on his pulled fly balls. Check out the table below measuring Didi’s pulled fly balls:
| PAs | HRs | HR% | |
| 2015 | 41 | 8 | 19.5 |
| 2016 | 41 | 17 | 41.4 |
| 2017 | 64 | 21 | 32.8 |
Didi’s jump in 2016 is particularly confusing because more production on the same amount of attempts is not sustainable without measured growth. So it makes sense that Didi hit a lower percentage of HRs on his fly balls in 2017, but the overall increase in sample size led to the increase in overall HR production, which makes sense when we remember his percentile rank in pulled fly balls from earlier. That HR/FB% is still astronomical though. For reference, Giancarlo Stanton has a career 45.1% HR/FB% on pulled fly balls. Given the power gap, Didi should not be able to sustain anywhere near his 2016-17 numbers. In fact, Didi’s 36.2% HR/FB% on pulled fly balls over the past two seasons equals Anthony Rizzo’s and I invite anyone to tell me why those two should be equal. Instead, let’s compare him to someone a little more similar, Ian Kinsler. I chose Kinsler because he has similar pull rates and FB%s with a somewhat similar swing- Knsler’s career HR% on pulled fly balls is 26%. If Didi homered at this rate, he’d lose roughly 6 homers each season, and that starts to get to the heart of it. Didi’s 12.5% overall HR/FB% doesn’t look extreme in and of itself, but when you break it down, the holes start to form.
Didi is a conundrum. His numbers seem to contradict themselves at times, and when you start to think he can’t repeat his numbers, 2017 happens. Despite a two-year track record, I just don’t buy it. He’s a .260 hitter who will hit about 15 home runs. But then again, we said that last year. To quote our own Ben Palmer, with whom I consulted on this article, “If he hits like 30 home runs this year, I’m gonna lose my mind.”
This reminds me of JJ Hardy around 2011-2013. Not much natural power, but a swing that would loft balls just over the fence in the left field corner. That ability disappeared in 2014.
Yeah, it looks like Hardy had a similar jump in HR/FB%. He also had a similar HR/FB% on pulled fly balls over that time to Didi 2016-17 and a 25.6% career mark, similar to Ian Kinsler. Love the comp and I appreciate you pointing it out! I didn’t even think about Hardy.
As a DiDi owner, I appreciate the work you did on this article. It’s, of course, the impetus for tonight’s performance!
Happy to help
This is why you shouldn’t look quite as much into the advanced stats, yes they provide useful information and good in some instances, but anyone with a pair of eyes can see that as long as Didi is a Yankee and has that right field porch, the home run numbers will stick around the 18-30 mark depending on the amount of mistakes by pitchers… but it really takes a dummy to not be able see the natural hitter that Didi has become, his biggest crutch is his plate discipline, he would be an even better hitter (over .300 avg) if he were to just take a few borderline pitches to get to a mistake pitch. Advanced metrics are no match to just the eye test. Didi has very good hand-eye coordination and a very quick bat… Just use your eyes, not your computer.
I get that.
Things like a quick bat and ability to put the bat on the ball and the positive impacts of them can be seen in statistics though. Everything the eye test captures can be measured in some kind of stat. The eye test helps, and it’s why I put some gifs in there to show the physical differences in his swing. It’s important to understand strong mechanics and I feel I addressed that- however, I believe that our eyes can lie but numbers can’t, and a strong understanding of performance takes looking at the eye test as well as what’s under the hood. What xStats also tries to do is try there to match what we see with our eyes by separating actions from results to give us unbiased numbers.
I think the biggest surprise for me about Didi was how relatively few home runs he hit at home in 2017. You’d think a player like him with that wall in RF would hit far more at home. I’m not sure how the eye test explains away his low EV and distance on home runs or that distinction. If he regresses by 5 HRs on the road, that gets us down to 20 without touching his production at home.
The guy has become a good hitter, I don’t disagree with you. But as one commenter said, people said the same thing about 2011-13 J.J. Hardy and he fell off the face of the earth afterward.
Love how this article comes out the day Didi goes 3/3 with 2 home runs, a double, walk, 8 RBIs, and 3 runs. Truly mysterious!
Dave, I know this piece looks like it should be burned based on Didi’s historic record-setting performance (the 1st shortstop in MLB history with at least 8 HR and 27 RBI in team’s 1st 22 games). But I just want to say even though you ended up being ‘wrong,’ I feel like the process and analysis you performed in this article were extremely sound. I came to the same conclusion and wound up not buying him anywhere based on his extremely large disparity between xStats and real stats.
The commenter above iNFINITY4K is flat-out wrong when he says “Advanced metrics are no match to just the eye test.” Sorry but that’s a bunch of hooey and I think we all know that. Being an avid Yankee fan and having watched Didi very closely, there was absolutely no indication he was going to make “The Leap” this year. However, the same commenter above (iNFINITY4K) did correctly point out that Didi does have those insanely quick hands and could take his game to the next level by chasing less and being more selective. And Didi has done exactly that, spitting on bad pitches so far: 2017 O-Swing 41.7%, 3rd percentile (5th worst)… 2018 O-swing 27.7%, 53rd percentile).
He also looks to be more direct to the ball with his swing, no more looping around to hook it. And also much more balanced, no more falling over after a swing. That comes through in his swing and miss rate (SwStr%) decreasing from 11.7% last year to 7.8% this year (10.6% is league avg), and his in-zone contact rate (Z-Contact%) increasing from 88.5% to 92%. He also increased his hard hit% from 23% to 38%, decreased soft contact by 5%, and exchanged some grounders for liners and fly balls.
Basically there was no way for us to know that in his 6th season at age 28, Didi would tweak his swing to take full advantage of his lightning quick hands resulting in a a 4 mph increase in avg exit velo AND stop swinging at bad pitches. He was kind of frustrating to watch as a guy that just hacked too much but flashed some upside due to his insanely quick hands. His hands and swing always reminded me a little of Curtis Granderson in that sense. And if you dig into his xStats further, you can see his swing has changed to a more optimal plane this year: by the xStats definitions his line drive% and fly ball% are the same, slight decreases in dribble ball% and popup%, but a massive decrease in ground ball% and massive increase in high drive % (which is the most valuable launch angle bucket).
Thanks for the in-depth comment, Mike. You’re not wrong- I’m working on a follow-up piece right now which incorporates a lot of what you’re saying.
Thanks A Lot!
DiDi is great Ever…….
Fast hands …that’s all I see here….hell he doesn’t even get his back leg turned. It’s pointed at the SS and that’s exactly where his shots were in 2015. I think the only reason he’s to his field is because loader earlier in 2017… And notice his back leg still finishes pointing to SS…….average will fall as his age goes up….as will the HR that barely make it out today.